Fix the data extracted into 1 single column in an excel report
Depending of the system tool I am using, it happened already that in the tool, the information is showing nicely but when I extracted the data into excel, all the columns are put into 1 single column. I remember the first time it happened, I was thinking that I was doing something wrong, so I repeat it again and got the same result.
All the cells in the column A had the information but they are not separated. If in the tool, each data were divided properly into its respective columns, extracting into excel, put them all in 1 single one which was the column A.
From this moment, I have 2 choices:
- Do it manually but when I had 20 cells or more, it is not easy, well, even if there is only 1 cell
- Or use the “text to columns” option.
Imagine I have this:

So to make the data appear correctly:
- 1. Select the whole column, in this case, the column A
- 2. Click on “data” then “text to columns”

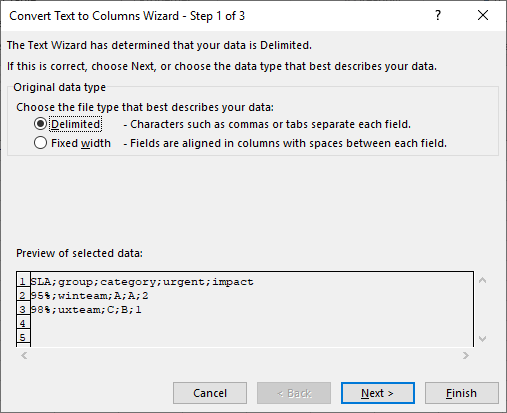
- 3. Select “delimited” or “fixed width” then click “next”. Select based on your data and the description, in this example, the one suiting the best is “delimited”

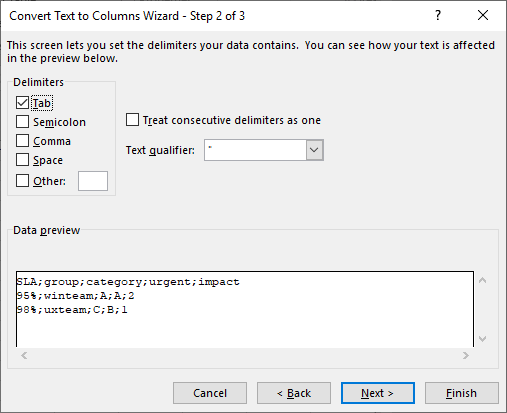
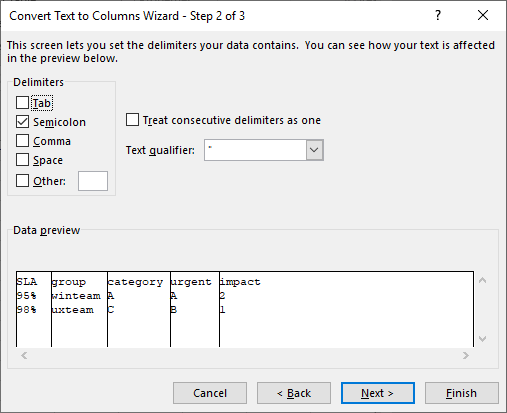
- 4. Select one of the options then click “next”. Again select the one fitting better, in this example, the data are separated by “semicolon”
 |
 |
- As we can see, the result preview is quite promising
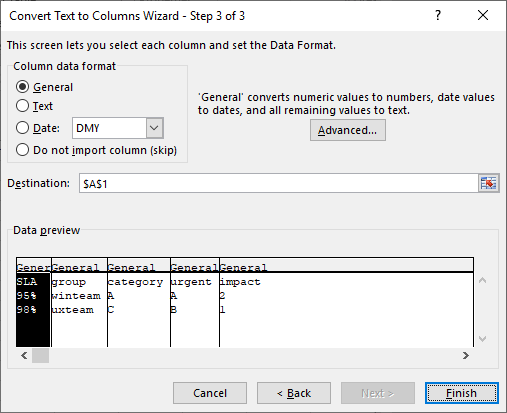
- 5. Keep the “general” option then click “finish”

And this is the final result:

As you can see, now, all data are correctly separated and put in their corresponding columns for each row.
Interesting Topics
-

Be successfully certified ITIL 4 Managing Professional
Study, study and study, I couldn’t be successfully certified without studying it, if you are interested...
-

Be successfully certified ITIL 4 Strategic Leader
With my ITIL 4 Managing Professional certification (ITIL MP) in the pocket, it was time to go for the...
-

Hide visual and change background color based on selection
Some small tricks to customize the background colour of a text box...
-

Stacked and clustered column chart or double stacked column chart
In excel, I use a lot the combination of clustered and stacked chart...


