Display row results in column with a formula in an excel report
It is very easy to display a vertical result (in row) but sometimes, I need to show the same result in horizontal (in column).

When I use the formula ?
Every time I need to show the results in column instead in row.
How to use the formula ?
The formula in this topic is with "," so depending of the operating system of your PC, the formula should have ";" instead of ",".
How is/are the formula(s) ?
=INDEX()
=ROWS()

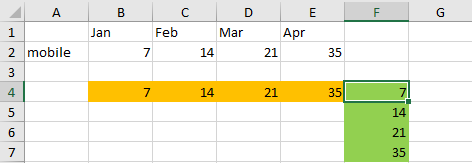
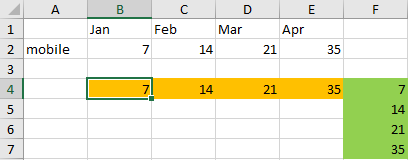
As you can see in the picture above, the orange section is displaying the results of the row 2 in vertical with this simple formula “=B2”, very easy so need more explanation.
Now as shown in the other picture, the green section is displaying the results of the row 2 in horizontal with this formula:
=INDEX($2:$2,ROWS(B$2:B2)+1)
If you put this formula in the sheet2 and the results are in the sheet1, the formula is:
=INDEX(Sheet1!$2:$2,ROWS(Sheet1!B$2:B2)+1)
Explanation
- 1. $2:$2 is the row where are the results
- 2. B$2:B2 is the column where the results begin
- 3. +1 is to tell the formula that it has to display from the column B. Imagine that your results start from the column C or you want only to display the result from the column C, in this case, put “+2”.
Interesting Topics
-

Be successfully certified ITIL 4 Managing Professional
Study, study and study, I couldn’t be successfully certified without studying it, if you are interested...
-

Be successfully certified ITIL 4 Strategic Leader
With my ITIL 4 Managing Professional certification (ITIL MP) in the pocket, it was time to go for the...
-

Hide visual and change background color based on selection
Some small tricks to customize the background colour of a text box...
-

Stacked and clustered column chart or double stacked column chart
In excel, I use a lot the combination of clustered and stacked chart...


