Round a number in percentage into a text with a formula in an excel report
One of the things I like to do in my reports, it is to create a simple and small automatic resume that I can put in my charts. This resume normally is always the same, only the number is changing, for instance, “today, we have 90% of incidents”. It means that the cell is a mix of text and formula then from my chart, I just do a simple cell reference.

When I use the formula ?
When I want to put a default comment in my chart in an automatic, simple and quick way.
How to use the formula ?
The formula in this topic is with "," so depending of the operating system of your PC, the formula should have ";" instead of ",".
How is/are the formula(s) ?
=ROUND()
=ROUNDUP()
=ROUNDDOWN()
I will explain only the “round” option because all work the same way. The only difference is that the “round” will do automatically the round up or down so if I want to force the round down, I use “rounddown”.
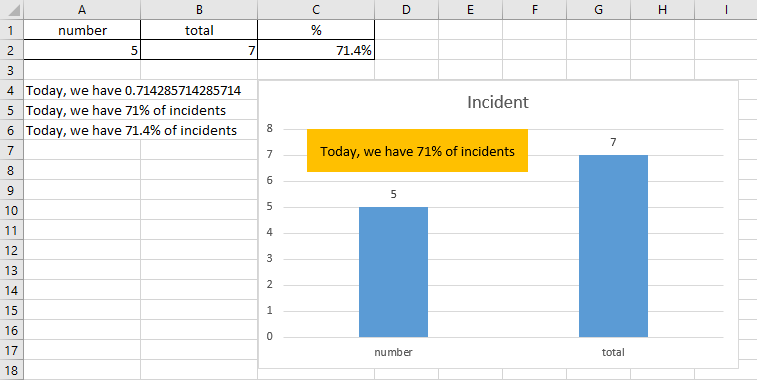
="Today, we have "&ROUND(A2/B2*100,0)&"% of incidents"

Explanation (row 5):
- A2/B2*100 is to calculate in percentage
- 0 is to tell how many decimal numbers I want to show so if I want to show 71.4, I will put 1 so I will have this way “A2/B2*100,1” (row 6)
And in my chart, doing a reference to the sentence cell, a good way to create a quick resume that will be updated automatically.
As you can see in the picture below, putting:
="Today, we have "&C2
I don’t get the correct result I want (row 4).

Interesting Topics
-

Be successfully certified ITIL 4 Managing Professional
Study, study and study, I couldn’t be successfully certified without studying it, if you are interested...
-

Be successfully certified ITIL 4 Strategic Leader
With my ITIL 4 Managing Professional certification (ITIL MP) in the pocket, it was time to go for the...
-

Hide visual and change background color based on selection
Some small tricks to customize the background colour of a text box...
-

Stacked and clustered column chart or double stacked column chart
In excel, I use a lot the combination of clustered and stacked chart...


