Update a formula for a 12 months trend chart using a macro in an excel report
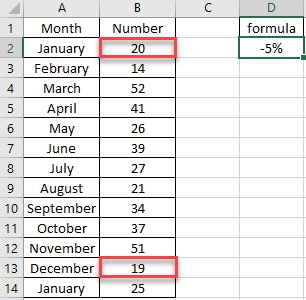
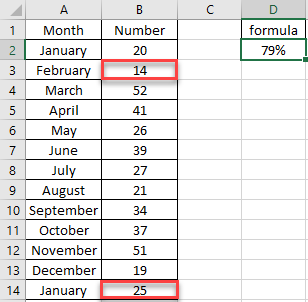
I have a trend chart showing the last 12 months, the point is that I needed to calculate for instance the percentage between the last month and the first month and since the last cell of a column and/or of a row is updated every month, this macro will look for it and update the formula.
 |
 |
When I use the macro ?
To find the last cell of a row and/or of a column in order to update the formula.
How to create the macro ?
Read How to create, edit, hide and select a macro in an excel report
How to create the button to associate it with the macro ?
Read How to create a button and associated it to a macro in an excel report
How is/are the macro(s) ?
Copy the code below and paste it into your macro. You will see my comments in green if exist so follow the help to adapt to your need.
For the column, for instance, in the cell D2, I have this formula:
=B13/B2- 1
Sub test()
Dim i As Integer
Dim j As Integer
i = Cells(Rows.Count, 2).End(xlUp).Row
' change 11 if you want less or more months
j = (Cells(Rows.Count, 2).End(xlUp).Row) - 11
' change D2 by your cell and B by your column letter
Range("D2") = "=B" & i & "/B" & j & "- 1"
End Sub
For the row, for instance, in the cell A2, I have this formula:
=SUM(B2:M2)
Sub test()
Dim i
Dim j
' change A1 by the first cell of your row where you want to check
i = Split(Columns(Range("A1").End(xlToRight).Column).Address(, False), ":")(1)
' change 11 if you want less or more months
j = Split(Cells(1, Range(i & 1).Column - 11).Address, "$")(1)
' change A4 by your cell and 2 by your row number
Range("A5") = "=SUM(" & j & "2:" & i & "2)"
End Sub
 |
 |
Interesting Topics
-

Be successfully certified ITIL 4 Managing Professional
Study, study and study, I couldn’t be successfully certified without studying it, if you are interested...
-

Be successfully certified ITIL 4 Strategic Leader
With my ITIL 4 Managing Professional certification (ITIL MP) in the pocket, it was time to go for the...
-

Hide visual and change background color based on selection
Some small tricks to customize the background colour of a text box...
-

Stacked and clustered column chart or double stacked column chart
In excel, I use a lot the combination of clustered and stacked chart...
-

Refresh Power BI
From the Power BI Service, I can set refresh but, for instance, there is no option to do it monthly or each time a change is made...
-

Power BI alerts to be sent by email from an excel file based on condition
I will explain how to send a list of emails from an excel file after creating alerts...


