Use a pivot table in an excel report
I use a lot the pivottable, no matter if I don’t or I have to modify the extracted data, mostly, I create a pivot table so all the calculs like summing, counting, etc. will be done automatically in a simple click.
Sometimes, it is not possible to have every result I want with 1 single pivot table with the same data, in this case, I have to create as much as needed. For instance, I want to know the result for the team1 and the team2. For a better understanding, imagine I extracted this data from my service management tools.
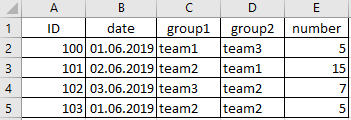
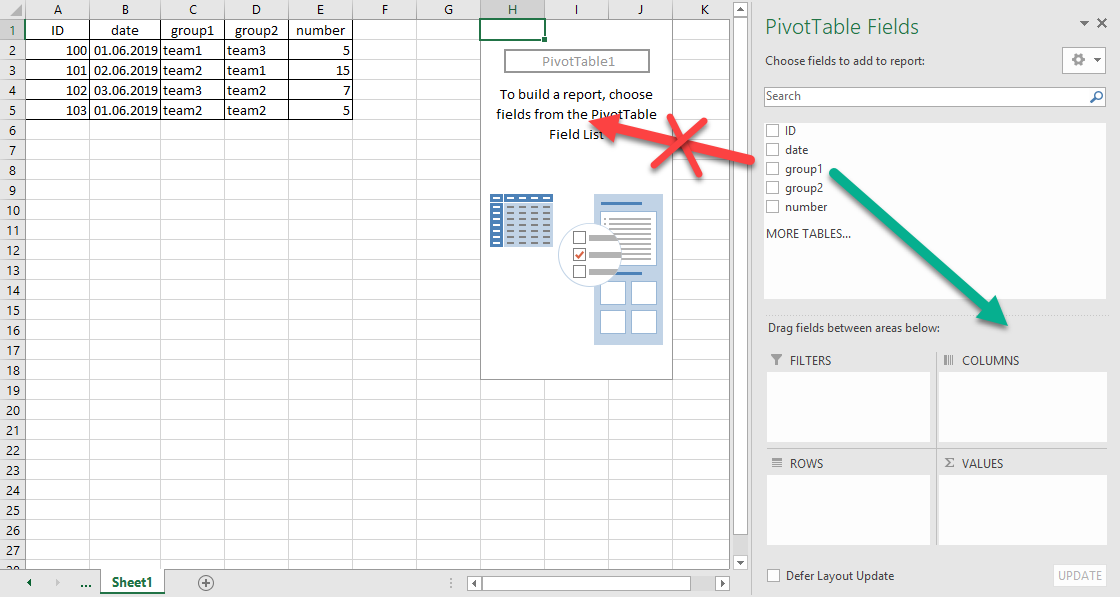
First, I have to select the sheet and/or the cell I want to put it. I will recommend in another sheet but for this example, I will put at the same sheet. At the end, how to create and to use it, it is the same way.
I select to put it in the cell H1 then I will click on the pivot table option.
 |
 |
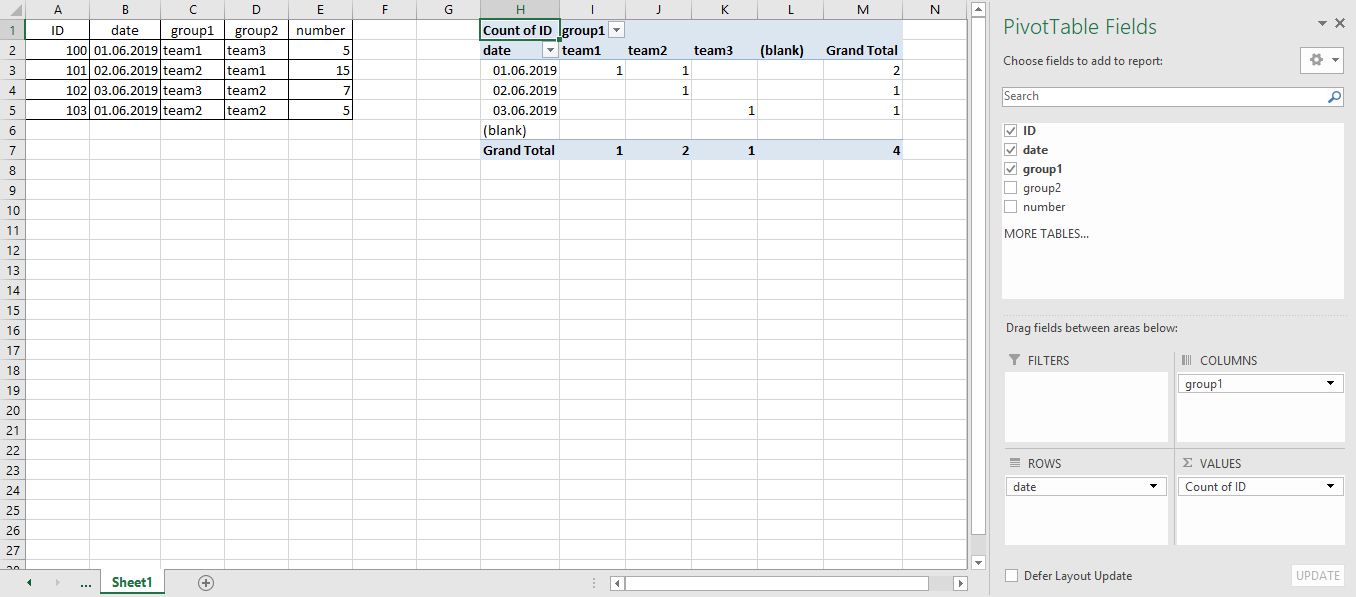
In the “table/range”, I just select the columns of my data so from A to E and I click “OK”. With the default option, I can’t drag the titles directly to the cell H1 so to get the result, I will drag them into the boxes. For instance, I want to know how many ID per team based on date.
As you can see, there is a result for “blank”, this is because I selected the whole column, if I selected only cells with data, the “blank” will appear only if there are blank cells amongst the data.
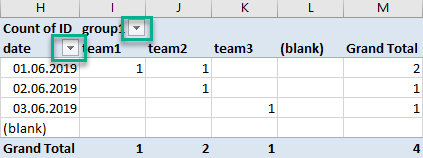
To remove it:
- In the “table/range” field, put “Sheet1!$A$1:$E$5”, instead of “Sheet1!$A:$E”
- Or click in the drop list option and unselected “blank”
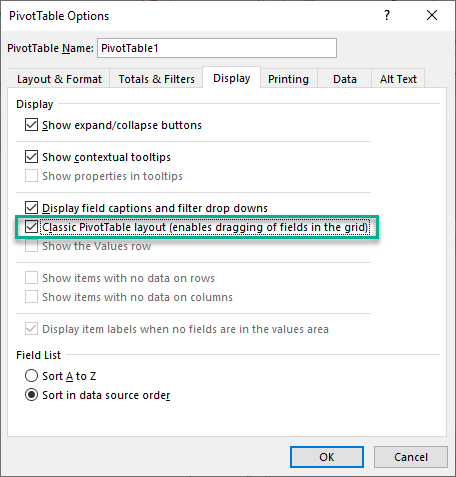
If you want to be able to drag the titles, right click on the pivot table and click on “pivottable” options and in the “display” tab, select the option below.
 |
 |
You will get this:
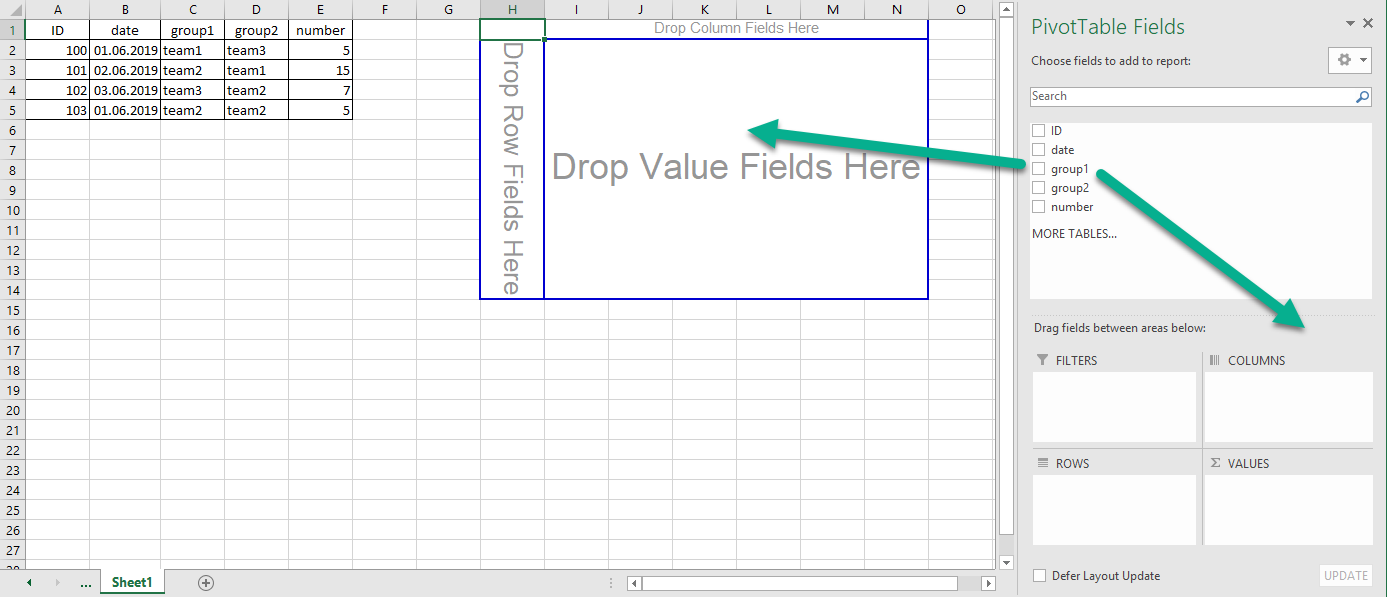
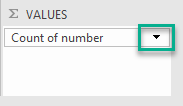
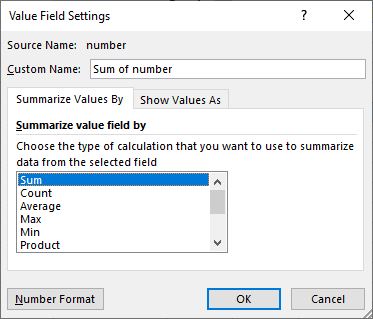
In the “values” box, there are different options. For instance, instead to put the “ID”, I put “number”, by default, it will count but if I want the sum, click on the arrow then click on “value field settings” and select “sum” then click “OK”.
 |
 |
Play with the boxes until to get the result you want.
Interesting Topics
-

Be successfully certified ITIL 4 Managing Professional
Study, study and study, I couldn’t be successfully certified without studying it, if you are interested...
-

Be successfully certified ITIL 4 Strategic Leader
With my ITIL 4 Managing Professional certification (ITIL MP) in the pocket, it was time to go for the...
-

Hide visual and change background color based on selection
Some small tricks to customize the background colour of a text box...
-

Stacked and clustered column chart or double stacked column chart
In excel, I use a lot the combination of clustered and stacked chart...


