


Power Automate: update an excel file from Power BI
Here, I will show you how to update an excel file from Power BI through Power Automate. The point is that the update will not be done automatically, I will need to click on a button. If you are looking for an automatic way, read Power Automate: update an excel file with Power BI. Before to start, there are 3 conditions:
- The excel file should be in the cloud (onedrive, sharepoint, etc.)
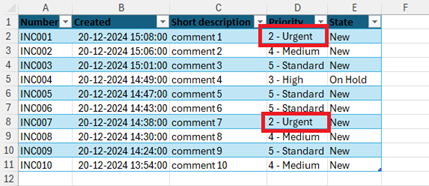
- In my excel file, the data should be formatted as a “table”
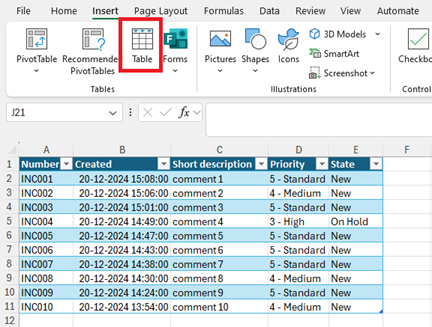
- The table should not evolve in rows, for instance, in my table, I have 11 rows so it should stay that way. If the data will increase or decrease, read Power Automate: update an excel file with Power BI
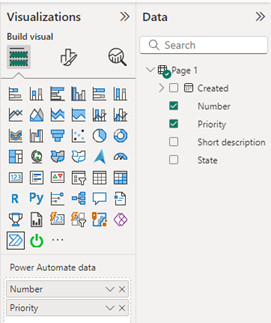
From Power BI, from the “visualizations” panel, click on this icon:
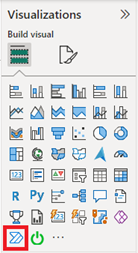
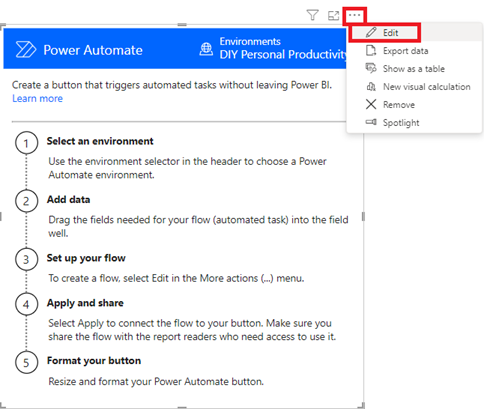
This popup will appear:
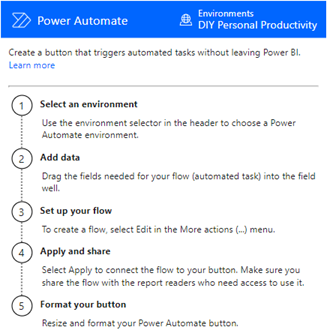
The step 1 is automatically done so I will go to step 2 by adding the columns that I want to update in my excel table, in my example, “number” and “priority”:
Once done, I will click on the 3 dots on the top right corner and select “edit”:
I will get this view, I can either click on “new” or scroll down to select “update an excel table from Power BI”:
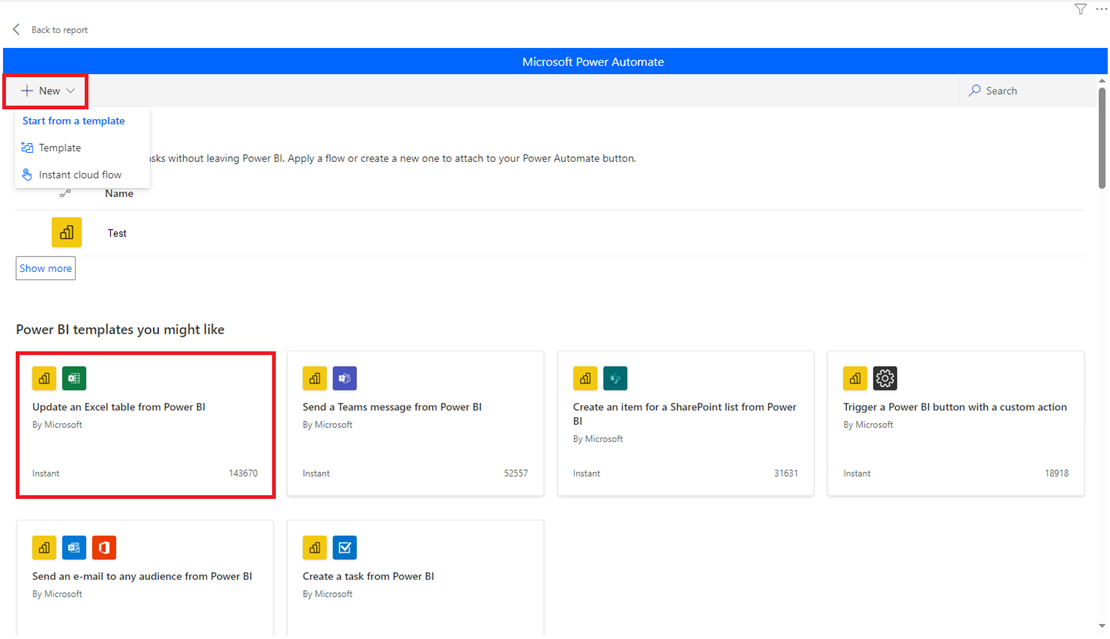
I will click on “update an excel table from Power BI” and after following the simple steps to validate my login, I will get this view:
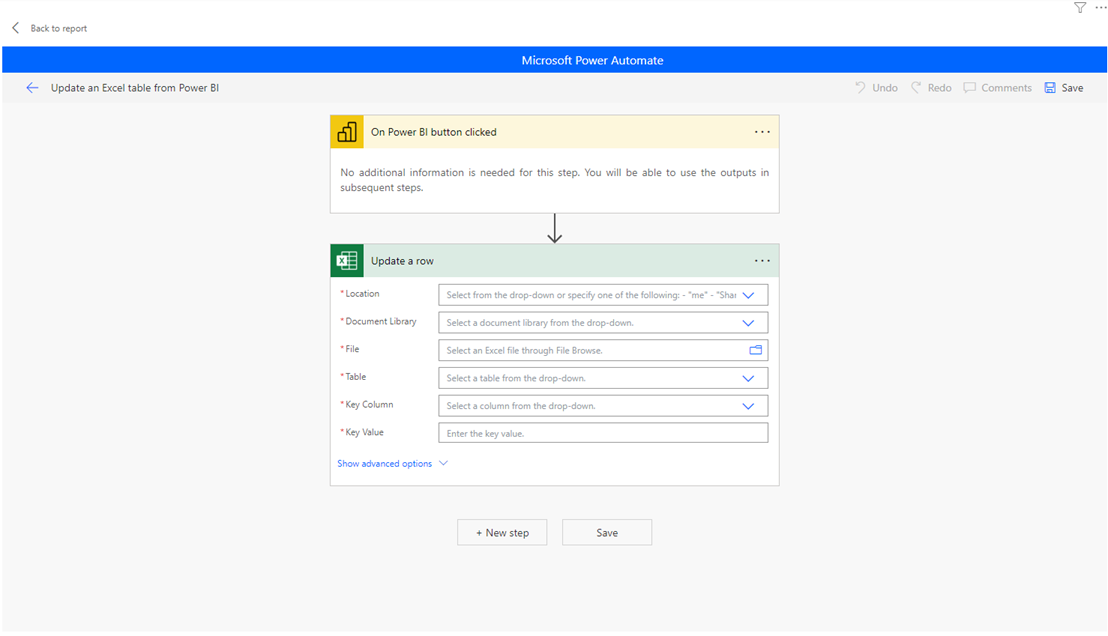
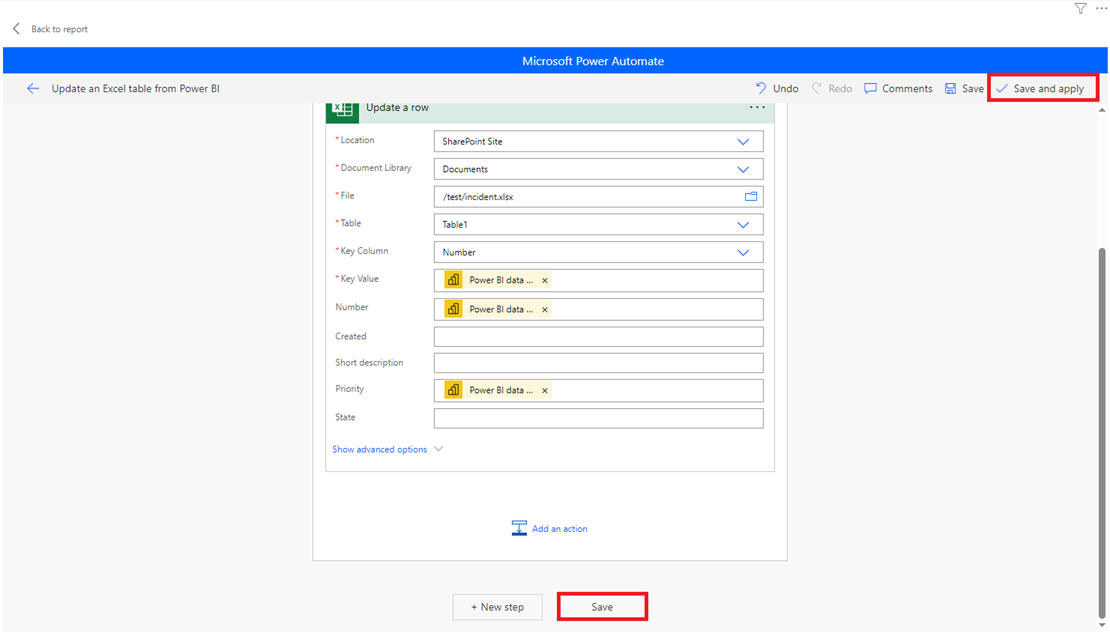
Starting to filling up the fields, I will get additional ones (they should represent the columns of my excel table) once reaching the “key column” field:
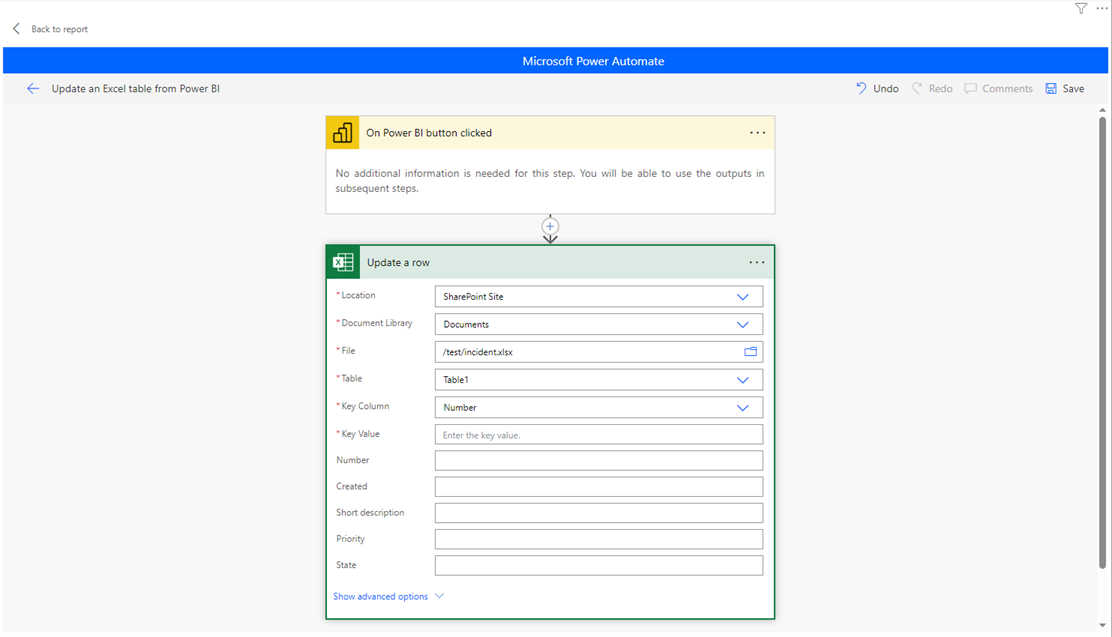
About the fields:
- Key volume: it should be a column with unique values. For my example, it is “number”
- Key value: related to the “key volume”, I can put a number, for instance “INC001”, in this case, I will only update the row of “INC001”. To update all rows, in the right panel, I will select “Power BI data Number”
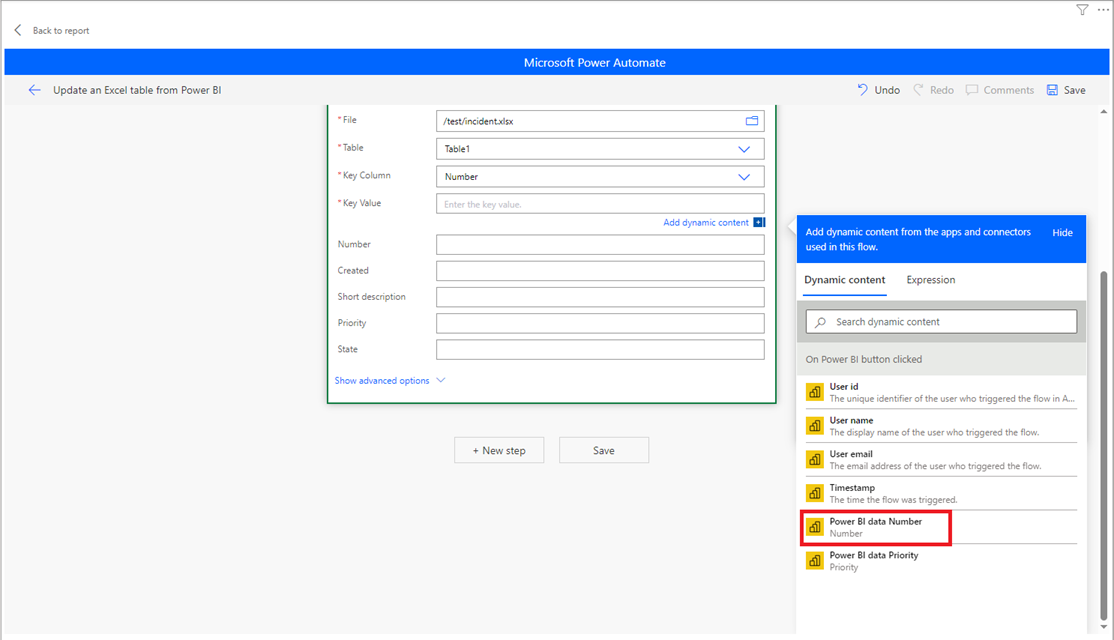
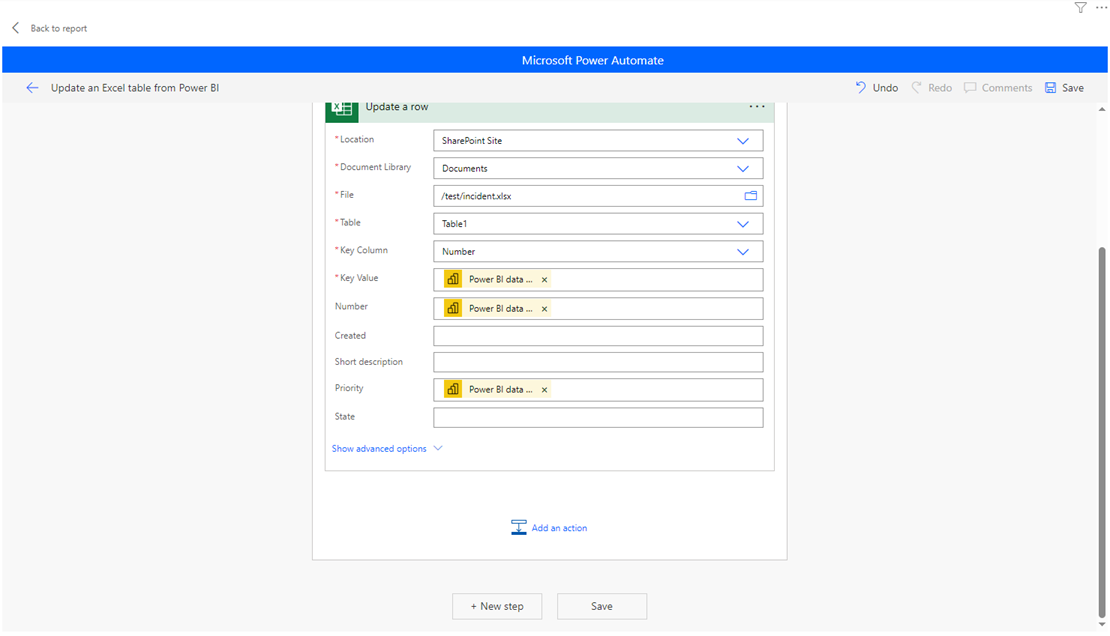
- The other 5 columns that correspond to my excel table, I will fill up this way:
- “number” is “Power BI data Number”
- “priority” is “Power BI data Priority”
- For the others, I will let it blank because if I put manually a value, it will update the column with the same value for all rows
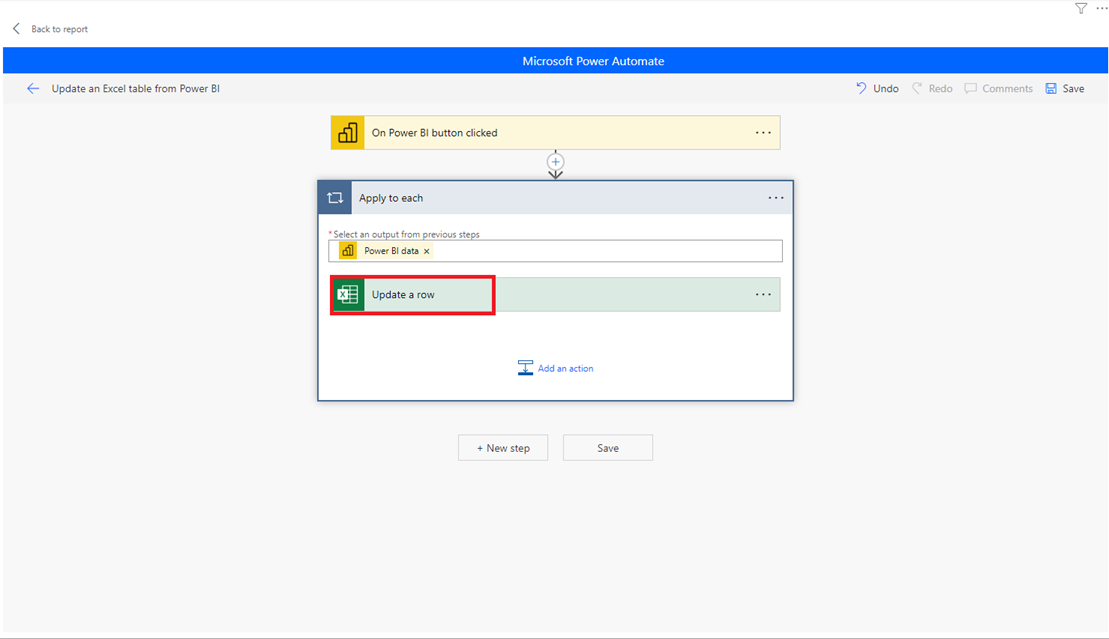
- NOTE: if you get this view, just click on “update a row”:
Once the fields are filled up, click on “save” then “save and apply” or directly on “save and apply”:
If all go well, I got this message then click “back to report”:
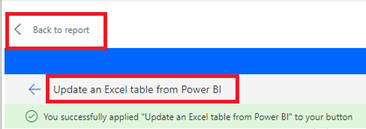
NOTE: if need be, change the name and if you don’t click on “save and apply”, the “run flow” button will not appear
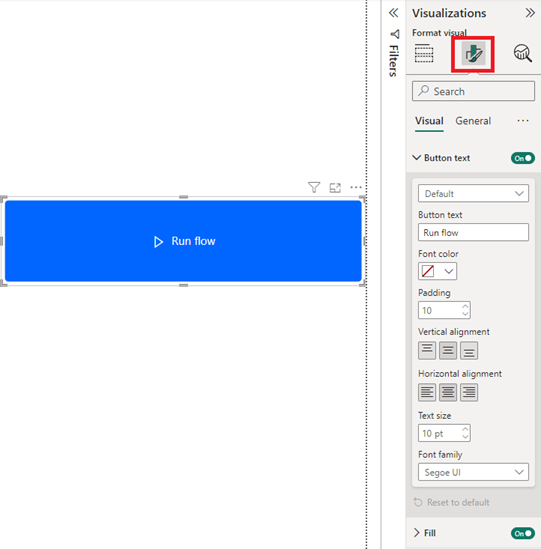
I can customize the button by clicking on “format your visual” icon. Once done, I will publish it and from Power BI Service, I click on the “run flow” button:
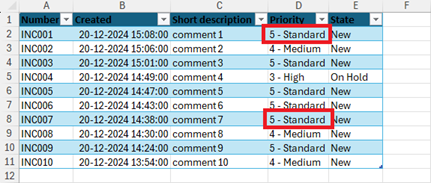
This is the result:
 |
 |
NOTE: the “run flow” button is not working in Power BI Desktop and once in the Service, I don’t need to add the report in the “app”
From the Power Automate webpage, I can access to the flow by clicking on “my flows”:
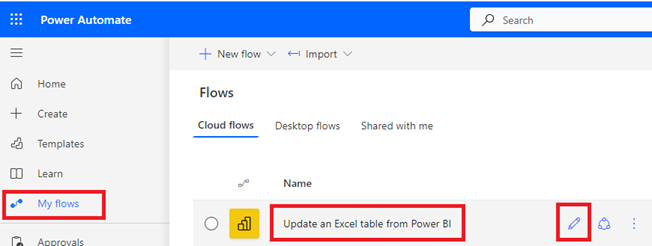
- Clicking on the “edit” icon to edit the flow from Power Automate, although I will recommend to do it from Power BI
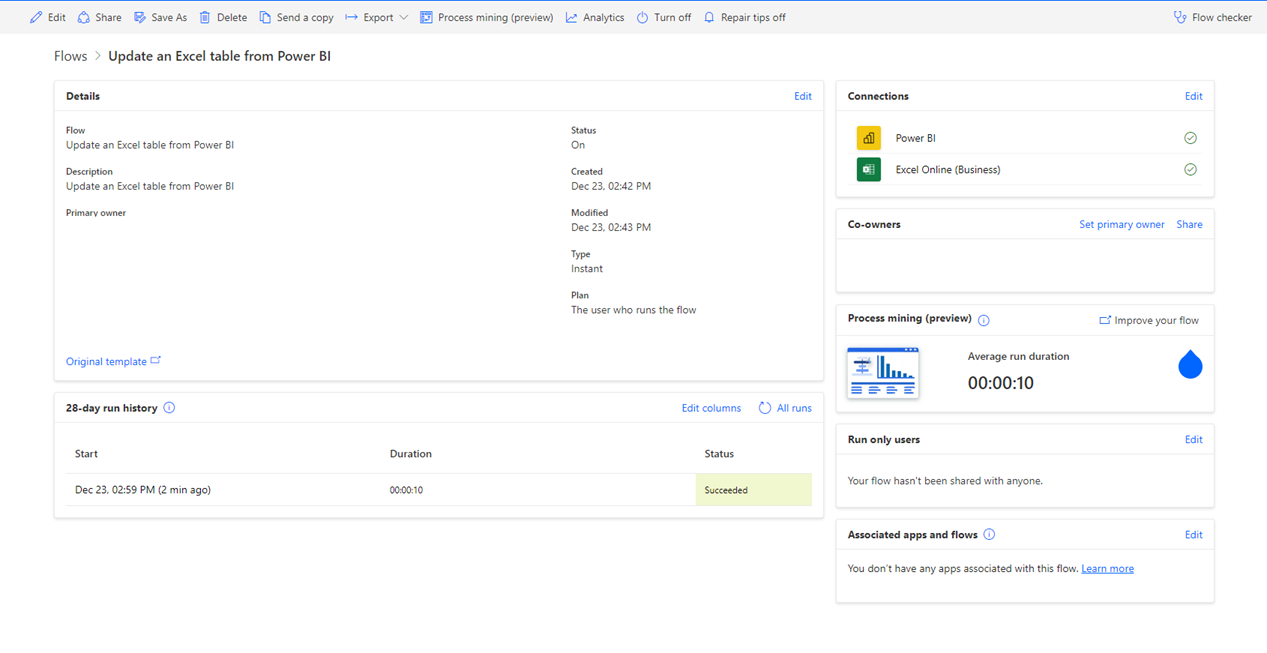
- Clicking on the name, I will get an overview
Interesting Topics
-

Be successfully certified ITIL 4 Managing Professional
Study, study and study, I couldn’t be successfully certified without studying it, if you are interested...
-
Be successfully certified ITIL 4 Strategic Leader
With my ITIL 4 Managing Professional certification (ITIL MP) in the pocket, it was time to go for the...
-

Hide visual and change background color based on selection
Some small tricks to customize the background colour of a text box...
-
Stacked and clustered column chart or double stacked column chart
In excel, I use a lot the combination of clustered and stacked chart...
-

Refresh Power BI
From the Power BI Service, I can set refresh but, for instance, there is no option to do it monthly or each time a change is made...
-
Power BI alerts to be sent by email from an excel file based on condition
I will explain how to send a list of emails from an excel file after creating alerts...
-
Count and check empty cells of filtered columns using a macro in an excel report
I use this macro to check if there are blank cells after I filtered...
-
Delete rows out of date using a macro in an excel report
In most of the reports, when I am doing the monthly one, I just need to keep all data that are in the month...
-
Find a specific value then insert a row and more things using a macro in an excel report
This VBA allows me to look for a specific value, it can be...
-
Execute a macro based on the day or time in an excel report
In some excel files, I am using a macro to tell it in which moment to do the report. For instance, if I am...
-
List unique values then combine in one single cell all data using a macro in an excel report
In one of my reports, I have to list from a column the unique values...
-

Copy/paste a range of values after finding the current date in an excel report
This script is to check and compare each cell of a specific column to...
-
Insert a row after finding a specific value in an excel report
This script allows to search a particular value, once find it, a new row will be inserted above or below...
-
Copy data between 2 sheets on top or bottom using an office script in an excel report
This online script allows me to copy the full data of a table to another...
-
Use a script to copy, cut, paste, replace and delete in an excel report (part 2)
This is the second part of my tutorial and it will be focused on...
-
Autofill from the last row using an office script in an excel report
This script will look for the last row then it will copy and paste the data to a number of rows below...
-

Calculate a weighted average for a SLA and a conversation time with a formula in an excel report
In one of my experiences, I had a tool that gave me the weighted average...
-
Search in different sheets then display the wanted data with a formula in an excel report
vlookup and hlookup are formulas that allow to search a data in another...
-
Find the good data by matching 3 different criterias with a formula in an excel report
It is a combination of “index” and “match” formulas, much better...
-
Sum and count sales with a formula in an excel report
Extracting data from salesforce or qlikview may not give the information I needed, it already happened...
Know how long a service is impacted with a formula in an excel report
It is important to know how long the service has been impacted by...