Power BI: between slicer in formula calculating/showing all values below or above filter selection
When I have a report with date and/or time, I may use the between slicer. Its behaviour is to show the corresponding selection between 2 values:
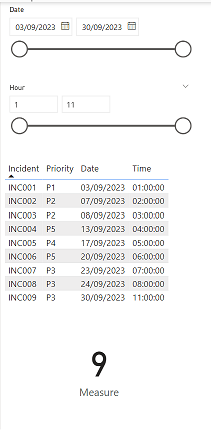 |
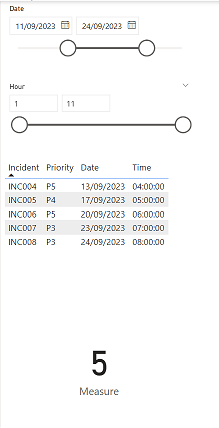 |
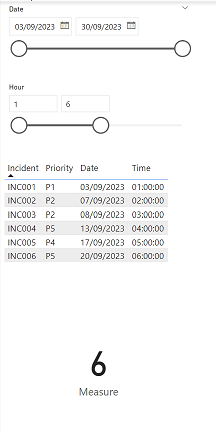 |
In some scenario, I can´t use this kind of slicer but others like the vertical list, the tile or the dropdown. In such situation, I need that those filters behave like the between one. Moreover, I will need that if I will select 3 different values, it will display the corresponding selection, not between them.
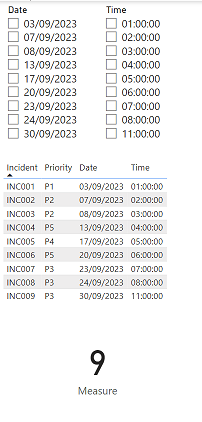 |
 |
 |
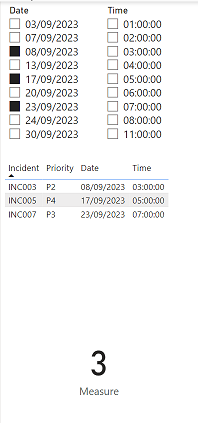 |
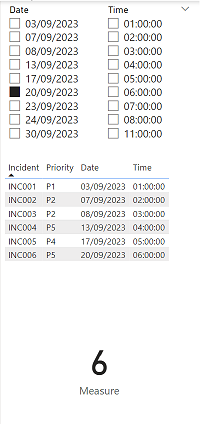
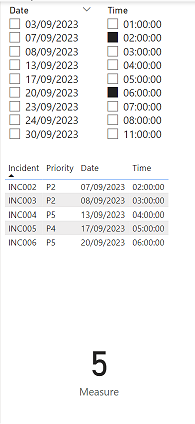
As you can see in the pictures above, by selecting the values, it behaves as the between filter showing all data below (it can be above) or between dates and the measure displays how many incidents but by choosing 3 values, they show exactly what I selected. I will explain how to do it with the date, take note that it is the same process with time, number, etc. (only formula will change).
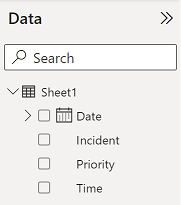
I have only one table called “sheet1” with those 4 columns:
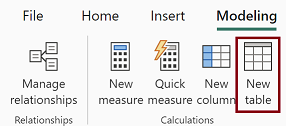
I will create a new DAX table with this formula: DISTINCT('table1'[argument1])
 |
 |
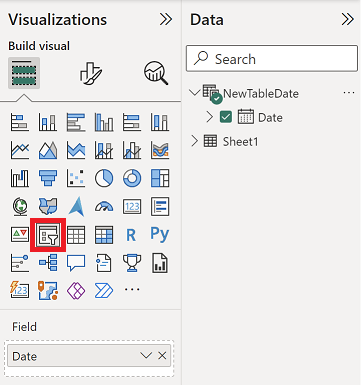
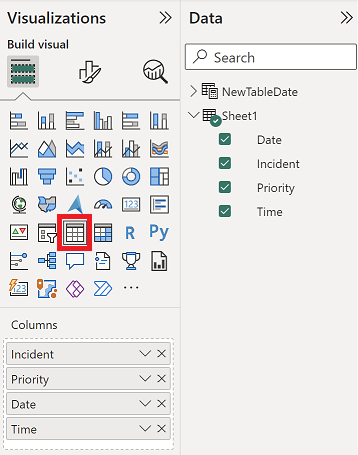
It will duplicate the “date” column of sheet1 and I will name it “newtabledate”. I will create a slicer with newtabledate and a table with all columns of sheet1:
 |
 |
I will create a measure to count the number of incidents with this formula:
IF(HASONEVALUE('table2'[argument]),CALCULATE(CALCULATE(COUNT('table1'[argument2]),FILTER(ALL('table2'[argument]),SELECTEDVALUE('table2'[argument])>='table2'[argument])),USERELATIONSHIP('table2'[argument],'table1'[argument1])),CALCULATE(COUNT('table1'[argument2]),FILTER(ALL('table1'[argument1]),'table1'[argument1]>=FIRSTDATE('table2'[argument]) && 'table1'[argument1]<=LASTDATE('table2'[argument]))))

IMPORTANT:
If the “newtabledate” filter has values that my table doesn´t have (for instance 28/09/2023), I will get a blank result. To avoid that, add the first blue part and change SELECTEDVALUE('table2'[argument]) by the second blue part.
var num = CONVERT(CONCATENATEX(VALUES('table2'[argument]),[argument]),DATETIME)
Return
IF(HASONEVALUE('table2'[argument]),CALCULATE(CALCULATE(COUNT('table1'[argument2]),FILTER(ALL('table2'[argument]),IF(ISBLANK(SELECTEDVALUE('table2'[argument])),num,SELECTEDVALUE('table2'[argument]))>='table2'[argument])),USERELATIONSHIP('table2'[argument],'table1'[argument1])),CALCULATE(COUNT('table1'[argument2]),FILTER(ALL('table1'[argument1]),'table1'[argument1]>=FIRSTDATE('table2'[argument]) && 'table1'[argument1]<=LASTDATE('table2'[argument]))))

The second blue part is using the first blue part which does 2 things:
- To extract the value of the filter which will be in text format
- Then to convert it into a date. To convert in another format, check the Microsoft CONVERT webpage
NOTE:
- To show above instead of below, only change >= by <= (green part)
- If I use “single select” instead of “multi-select”, I just need the yellow part
- For others (time, number, etc.) than date, replace the red part by:
'table1'[argument1]>=FIRSTNONBLANKVALUE('table2'[argument],MIN('table2'[argument])) && 'table1'[argument1]<=LASTNONBLANKVALUE('table2'[argument],MAX('table2'[argument]))

And another one to use it as a filter for the table:
IF(HASONEVALUE('table2'[argument]),IF(MAX('table2'[argument])>=MAX('table1'[argument1]),1,0),IF(SELECTEDVALUE('table1'[argument1])>=FIRSTDATE('table2'[argument]) && SELECTEDVALUE('table1'[argument1])<=LASTDATE('table2'[argument]),1,0))

NOTE:
- To show above instead of below, only change >= by <= (green part)
- If I use “single select” instead of “multi-select”, I just need the yellow part
- For others (time, number, etc.) than date, replace the red part by:
IF(SELECTEDVALUE('table1'[argument1])>=FIRSTNONBLANKVALUE('table2'[argument],MIN('table2'[argument])) && SELECTEDVALUE('table1'[argument1])<=LASTNONBLANKVALUE('table2'[argument],MAX('table2'[argument])),1,0)

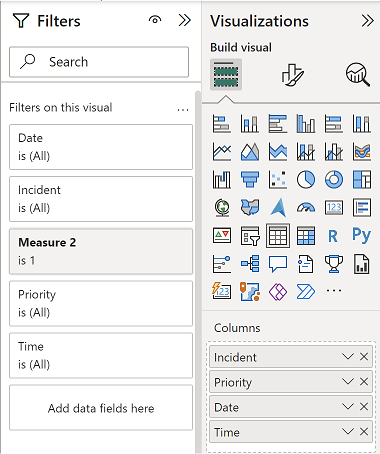
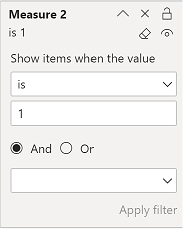
Then I will add it in “filters” (not in “visualizations”) of my table and as you can see in my picture, I configured to 1.
 |
 |
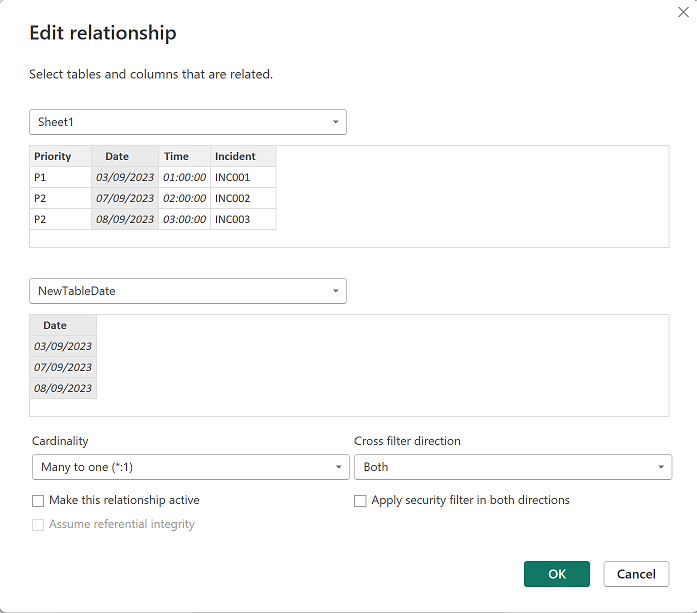
The last step is to create an inactive relationship:
 |
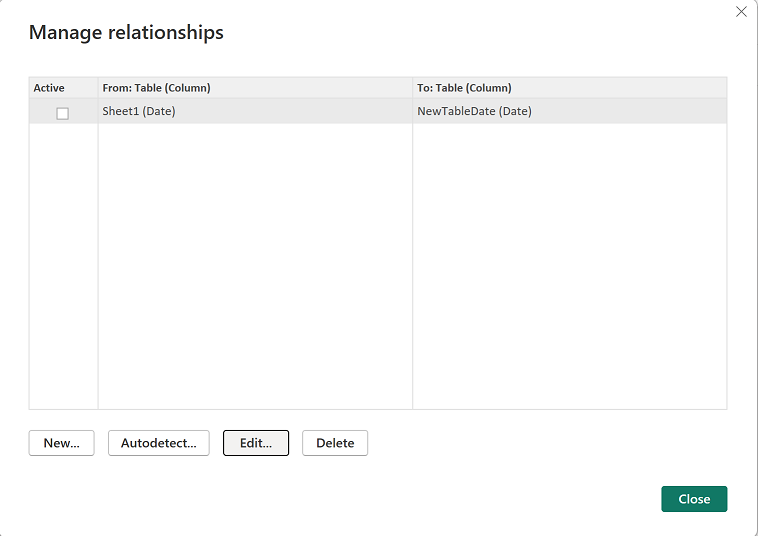 |
NOTE: by activating the relationship, it will come back to its default behaviour and it is not what I want. For the formula to work, I need to select the correct cardinality based on my data and for the “cross filter direction”, I selected “both” because I have a measure but if I had only a table, I can select “single” (not working for the measure).
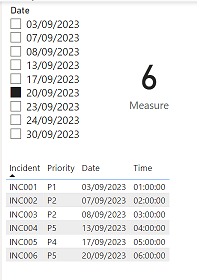
Everything is in place so by selecting those values, it behaves as the between slicer by displaying all below or between and the corresponding count:
 |
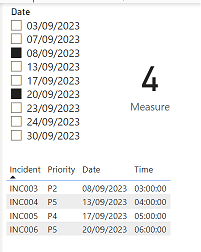 |
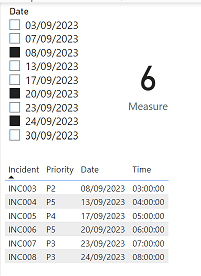 |
In the other hand, as you can see, if I select 3 or more value, it is not showing what I want. In such situation I need to introduce a new condition, if I select 3 or more, do that if not do this so the new formula for “measure”:
IF(DISTINCTCOUNT('table2'[argument])>=3,CALCULATE(COUNT('table1'[argument2]),USERELATIONSHIP('table2'[argument],'table1'[argument1])),first formula of measure)

And for “measure 2”:
IF(DISTINCTCOUNT('table2'[argument])>=3,IF(CALCULATE(COUNT('table1'[argument2]),USERELATIONSHIP('table1'[argument1],'table2'[argument])),1,0),first formula of measure 2)

The final result:
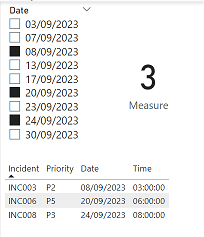
Interesting Topics
-

Be successfully certified ITIL 4 Managing Professional
Study, study and study, I couldn’t be successfully certified without studying it, if you are interested...
-

Be successfully certified ITIL 4 Strategic Leader
With my ITIL 4 Managing Professional certification (ITIL MP) in the pocket, it was time to go for the...
-

Hide visual and change background color based on selection
Some small tricks to customize the background colour of a text box...
-

Stacked and clustered column chart or double stacked column chart
In excel, I use a lot the combination of clustered and stacked chart...
-

Refresh Power BI
From the Power BI Service, I can set refresh but, for instance, there is no option to do it monthly or each time a change is made...
-

Power BI alerts to be sent by email from an excel file based on condition
I will explain how to send a list of emails from an excel file after creating alerts...


