Power BI: calculate the average of unique values
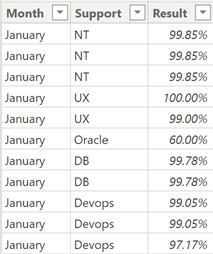
I have this table:

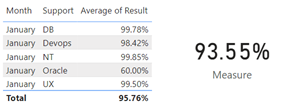
If I do an average, I got 95.76%, the point is that this calculation includes the duplicate numbers and what I want, it is to have an average of unique percentage to get 93.55%.

This is the formula:
AVERAGEX(DISTINCT(SELECTCOLUMNS(FILTER('table','table'[argument1]='table'[argument1]),"new name",[argument2])),[new name])

If I have other months and I want it per month, I will add another condition in the formula:
AVERAGEX(DISTINCT(SELECTCOLUMNS(FILTER('table','table'[argument1]='table'[argument1]),"new name1",[argument2],"new name2",[argument3])),[new name])

Based on my table, this formula may not work so alternatively, I use this one:
AVERAGEX(SUMMARIZE('table','table'[argument1],'table'[argument2]),'table'[argument2])


Interesting Topics
-

Be successfully certified ITIL 4 Managing Professional
Study, study and study, I couldn’t be successfully certified without studying it, if you are interested...
-

Be successfully certified ITIL 4 Strategic Leader
With my ITIL 4 Managing Professional certification (ITIL MP) in the pocket, it was time to go for the...
-

Hide visual and change background color based on selection
Some small tricks to customize the background colour of a text box...
-

Stacked and clustered column chart or double stacked column chart
In excel, I use a lot the combination of clustered and stacked chart...
-

Refresh Power BI
From the Power BI Service, I can set refresh but, for instance, there is no option to do it monthly or each time a change is made...
-

Power BI alerts to be sent by email from an excel file based on condition
I will explain how to send a list of emails from an excel file after creating alerts...


