Power BI: connect to the Jira database
After reading REST API from Atlassian developer website and looking into the internet, I found the way to connect to my Jira project to extract all incidents by using my account:
- For Jira server, with username and password
- For Jira cloud, with username and API token
The “general” steps below are for both but if you are using Jira cloud, create first your API token (if you don’t know how, read Manage API tokens for your Atlassian account).
NOTE: there is no need to convert your API token into BASE64 encode
I will also explain how to transfer from Jira server to Jira cloud so if you are interested in this part, look for the “move from Jira server to Jira cloud” section.
Before to start, I would like to make reference to this article PowerBI and Jira integration guide that I used to adapt to my needs. In this article, the author explains the “API filter” to get the data but unfortunately it doesn’t work for me. I am using the “API project” to export all contents.
General steps
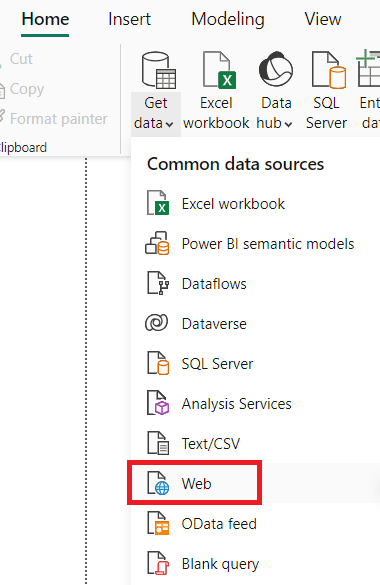
Open Power BI and click on “home -> get data -> web”:
- 1. Put the basic URL and click “OK”:
https://yourjira/rest/api/2/search?jql=project="projectname"

NOTE: change “yourjira” and “projectname” by yours - 2. In the authentication window, select “basic” and I put my credentials:
- For Jira server, the ones I use to connect to Jira
- For Jira cloud, in the password, I will put my API token
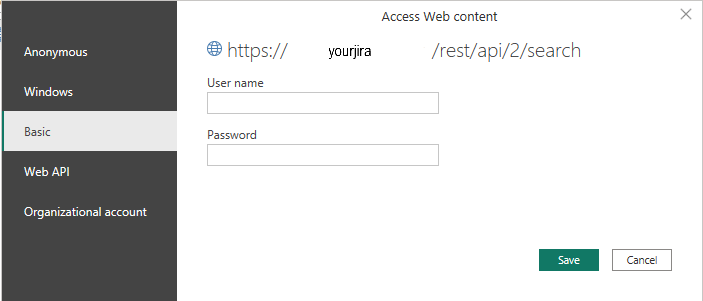
NOTE: this window will not appear anymore once I will be connected to Jira - 3. It will open the power query editor and from here, for “list” and “record” columns, click on the expand icon to select what I need
NOTE: it takes few minutes to connect to Jira and I only get the last 50 incidents - 4. Once done, click on “home -> close & apply”
About the 2 types of columns:
- List: select “expand to new rows” if I want to have each value per row or select “extract values” if I want to have all values in 1 single row
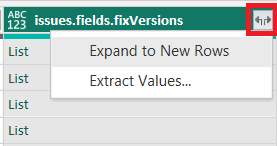
NOTE: if “extract values” gives error values, it means that there are sub-columns so to see them, select “expand to new rows”. - Record: to display sub-columns of the main column
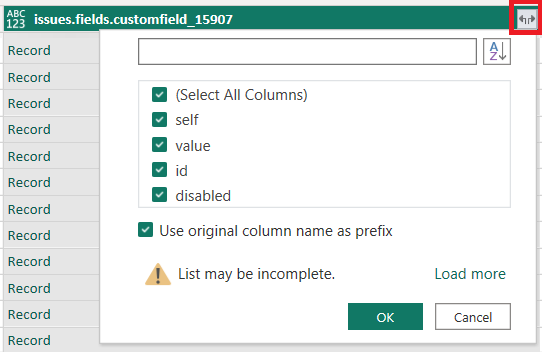
After expanding the record of the main column, if the sub-columns are not what I need, I will just remove them from the “applied steps” section:
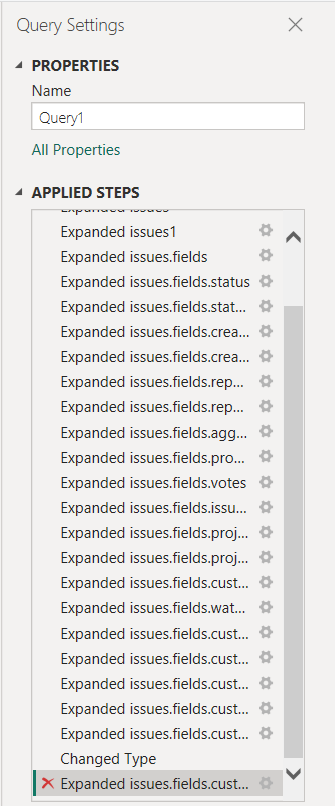
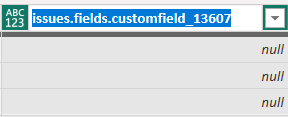
Same action for error values from “extract values” and if I want to rename the needed columns, just double click on the column name:
By default, the API gives only 50 values for 1 page due to a resource topic according to Atlassian. In the other hand, I can increase this number by adding “&maxResults=”:
https://yourjira/rest/api/2/search?jql=project="projectname"&maxResults=10000

NOTE: it will return the maximum that the API can support which will be normally 1000 values (default limit).
To get more pages, I will have to add “&startAt=”:
https://yourjira/rest/api/2/search?jql=project="projectname"&startAt=50

NOTE:
- If I want more pages, I will need to put 100, 150, etc.
- I can combine it with “maxResults”, in this case, the number will be 1000, 2000, etc. because of the default limit of 1000 values
For a big data, this method is not very effective so to get everything I am using this method:
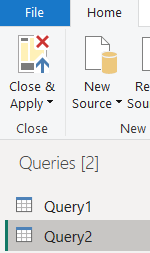
- 1. Using the basic URL, it will open the power query editor by creating “query1”
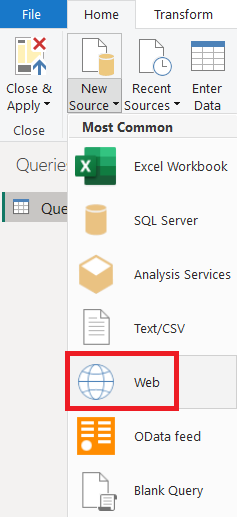
- 2. Click on “new source -> web” to create “query2” by using again the basic URL
 |
 |
- 3. Select “query1”:
- a. In the “applied steps”, select “source”
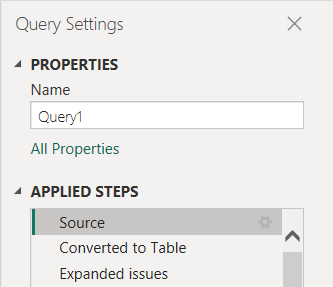
- b. Click on “list”
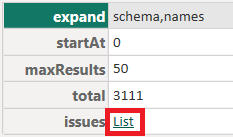
- c. Click on “continue”

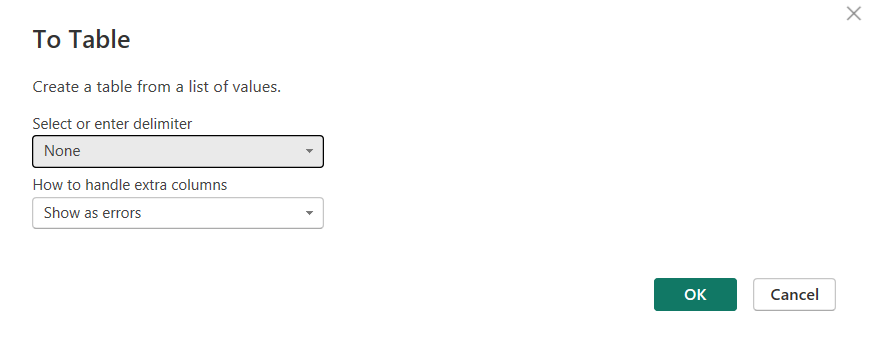
- d. Click on “convert to table”

- e. Click on “OK”
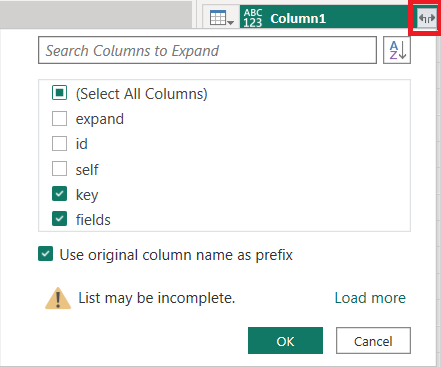
- f. Click on the expand icon to select the 2 columns as in the picture:
- g. Click on “home -> advanced editor”:

- h. Add those 2 parameters “(start as text) =>” and “,[Query=[startAt=start]]” like that:


- i. The final result is:
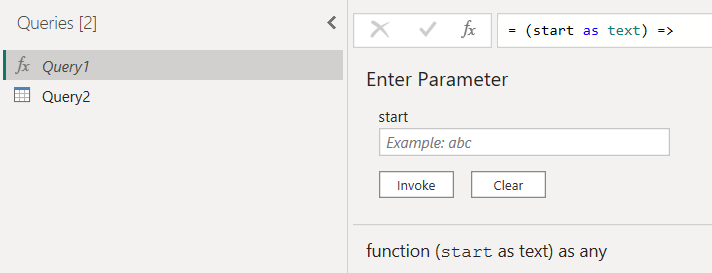
- a. In the “applied steps”, select “source”
- 4. Select “query2”:
- a. Click on “home -> advanced editor”
- i. Remove everything below “source” to have only this:

- ii. Add this below “source”:
total1 = List.Numbers(0,Number.RoundUp(Source[total]/50),50),
#"Converted to Table" = Table.FromList(total1, Splitter.SplitByNothing(), null, null, ExtraValues.Error),
#"Changed Type" = Table.TransformColumnTypes(#"Converted to Table",{{"Column1", type text}})
in
#"Changed Type"

NOTE: change 50 by the maximum value (for instance 1000) if need be
- i. Remove everything below “source” to have only this:
- b. Click on “add Column -> invoke custom function”
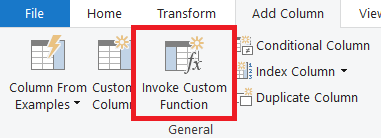
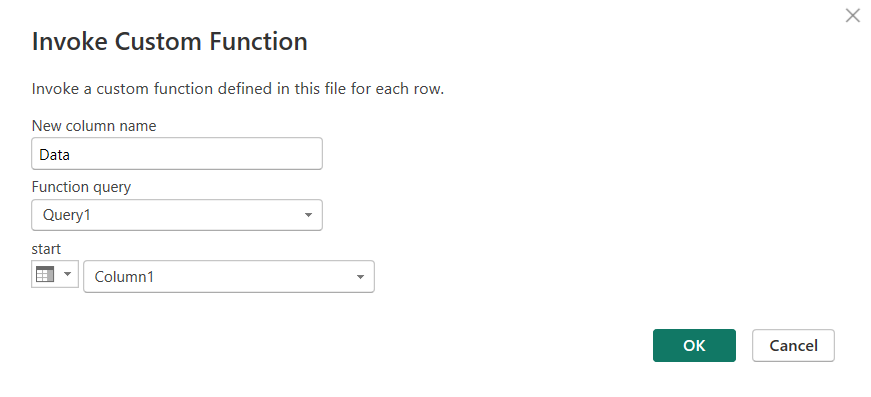
- c. Fill the fields as the picture:
- d. Click on the expand icon in the “data” column then “OK”:
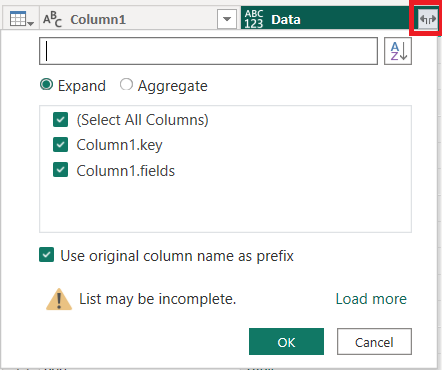
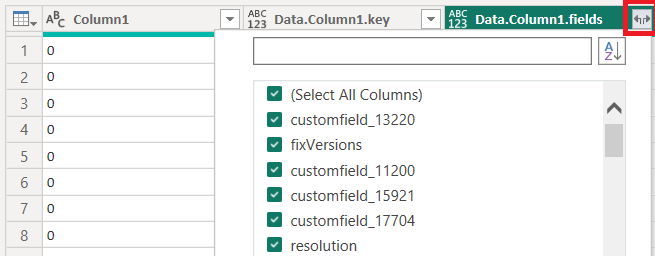
- e. Click on the expand icon in the “data.column1.fields” column to select the columns I need
- a. Click on “home -> advanced editor”
- 5. Once done, click on “home -> close & apply”
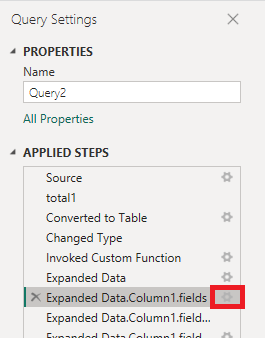
The tricky part is the column selection because if some names can give me a clue about the value, others with name like “customfield_13220” are not so easy. In such situation, I select all columns then I check one by one by clicking on the expand icon. Once I have the needed columns, to remove the others, in the “applied steps” section, double click on this icon below the “expanded data”:
Move from Jira server to Jira cloud
Imagine that I started with Jira server but my company upgraded to Jira cloud so my connection to Jira has stopped to work because with the cloud, the password is my API token and not anymore my login password. So after creating my API token, I will open my data source settings:
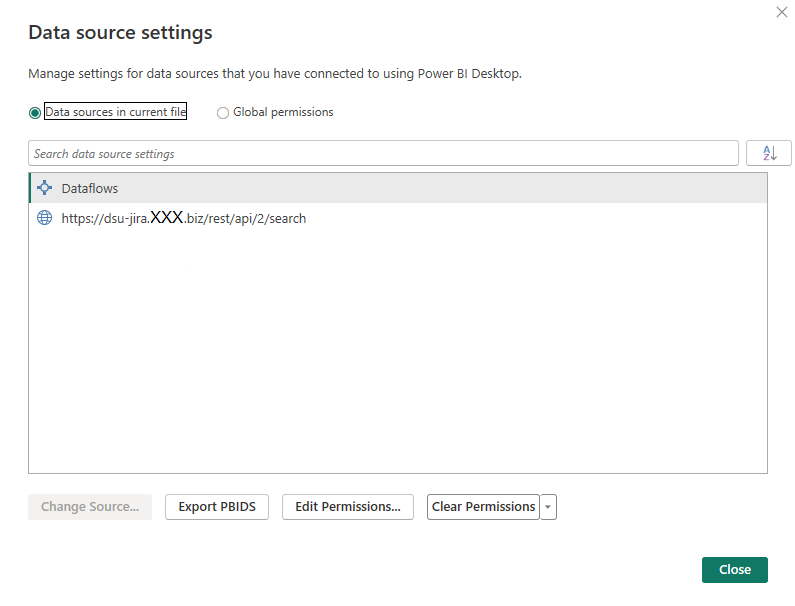
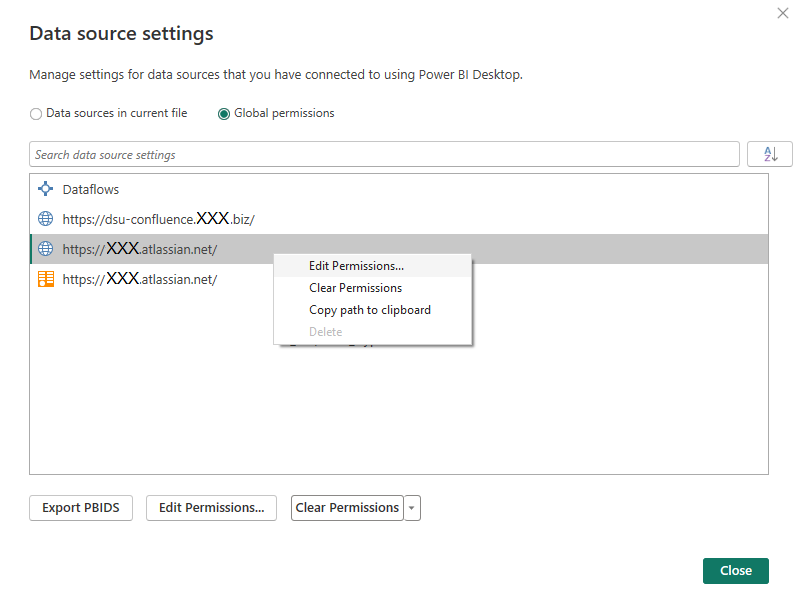
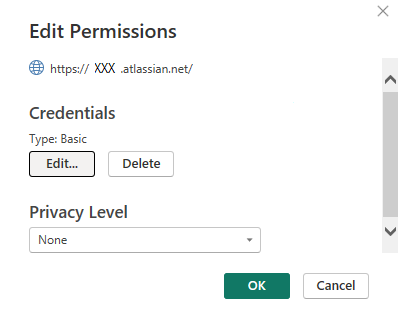
Select “global permissions” then right click on the first “atlassian.net” and click on “edit permissions”
Click on “edit”
In the “user name”, I put my account and in the “password”, I put my API token
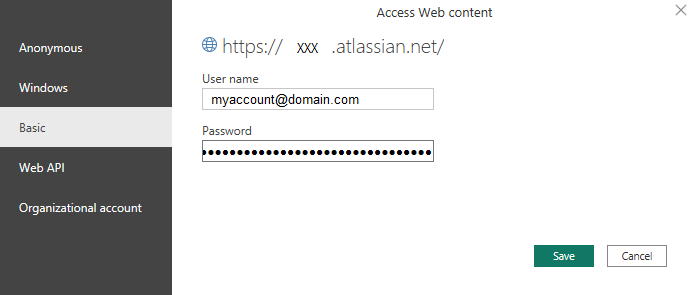
Once done, repeat the same things for the other “atlassian.net”.
NOTE: once connected to the cloud, some columns may have a different format. For instance, date/time column may be changed to a text format instead to stay as a date/time format
Interesting Topics
-

Be successfully certified ITIL 4 Managing Professional
Study, study and study, I couldn’t be successfully certified without studying it, if you are interested...
-

Be successfully certified ITIL 4 Strategic Leader
With my ITIL 4 Managing Professional certification (ITIL MP) in the pocket, it was time to go for the...
-

Hide visual and change background color based on selection
Some small tricks to customize the background colour of a text box...
-

Stacked and clustered column chart or double stacked column chart
In excel, I use a lot the combination of clustered and stacked chart...


