Power BI: create, publish and update a dashboard for beginners - Part 1: upload the data
If it is the first time you will open Power BI, this article is for you. This tutorial is divided in 4 parts:
- Part 1: upload the data
- Part 2: create the report
- Part 3: share with the audience
- Part 4: create the dashboard
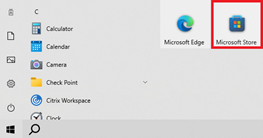
Based on what you know, you may go directly to the part that you are more interested. First at all, always download the program from Microsoft Store even if in your enterprise, it can be downloaded from the internal company store. The reason is because the update is done more frequently in Microsoft Store than in your internal company store.
Before to start, I will clear some doubts, generally, people will say "can you create a dashboard in Power BI", 99% of the time, I will create a report and not a dashboard. Power BI makes a difference between both:
- A report can have multiple pages and it can be created with Power BI Desktop (in my laptop)
- A dashboard is a compilation of data from 1 or multiple reports in 1 single page only and it has to be created only with Power BI Service (only in the cloud)
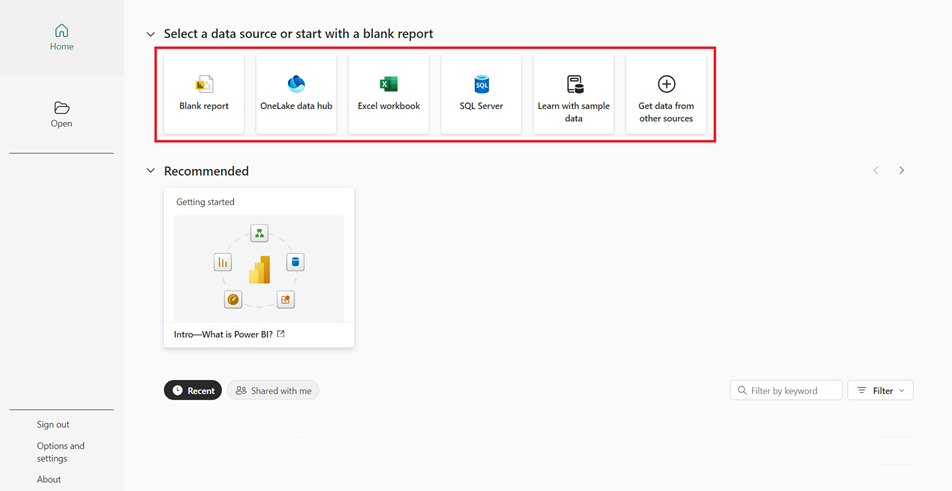
To answer to the question "do I have to create a dashboard to share with other people", the answer is "no", creating a report is enough to share with your audience. The main way to create charts, tables, etc. to build your report is to use a data source from, for instance, SQL database, an excel file, an oracle database, Jira database, ServiceNow database, etc. so when you open Power BI, this option will appear at the top:
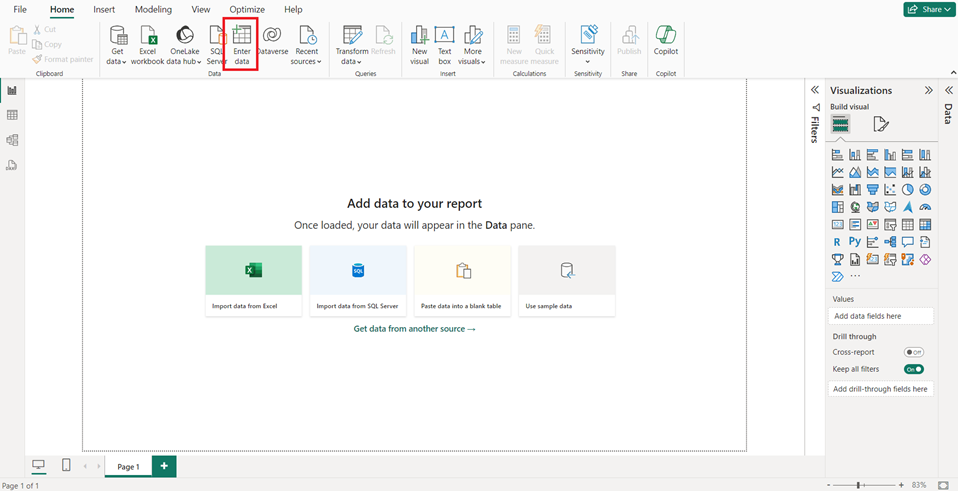
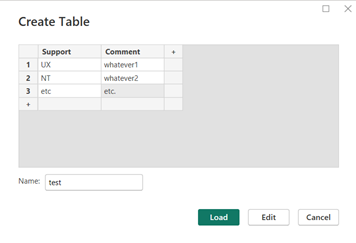
You can enter manually the data but this option is hidden and also, it is not the efficient way to work with Power BI. Anyway, if you want this option, click on “blank report” then on “enter data”:
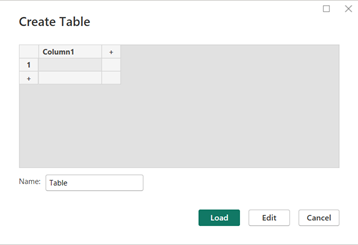
- Name: change “Table” by whatever you want
- Column1: double click to change whatever you want
- In the cells below: double click to put whatever you want
Once done, click on “load”:
 |
 |
It will appear in the “data” panel:
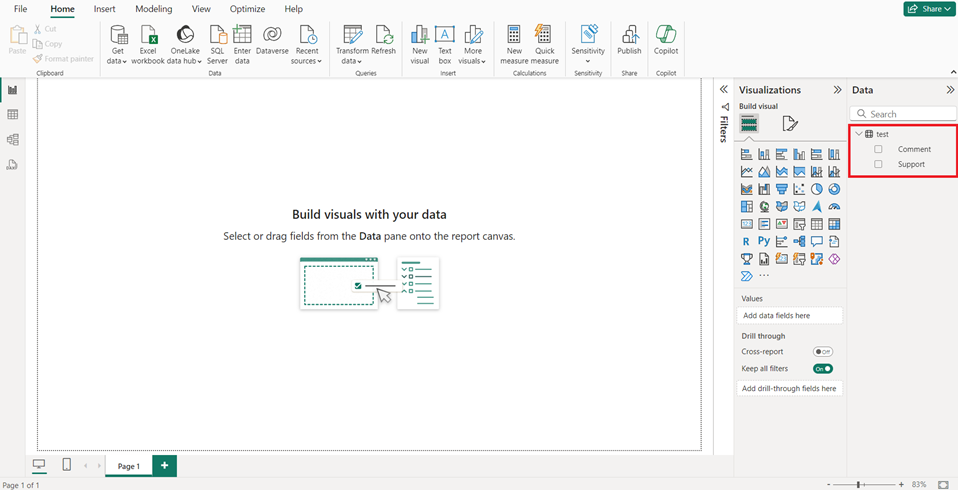
I will not recommend this manual option except if your data will never be updated so you may wonder “why there is this option ?”. For some cases, it will be useful and I will explain later with an example.
Imagine that my data source is an excel file, I will click on “excel workbook” if located in my laptop. In case if my excel is located online (for instance in “sharepoint”), I will click on “get data from other sources” then “other -> web”:
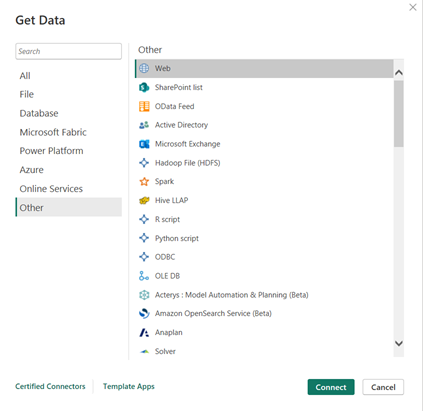
Once done, click on “connect” then put the url:

In the “navigator” popup, select the source, in my example, I will select “table1”:
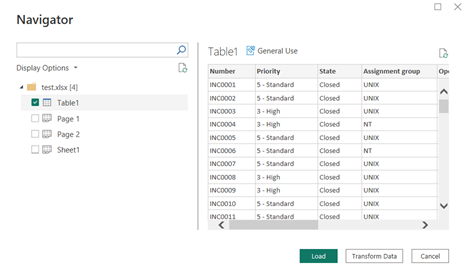
NOTE:
- Multiple sources can be selected
- For an efficient update, I will recommend to have your data in the web
There are 2 options:
- “Load” if I want to load the full data
- Or “transform data” if I want to load some data
This last option is very useful if I have a huge data because it will improve the performance by reducing the size of the data. I will show you, after clicking on it, the “power query editor” window will appear:
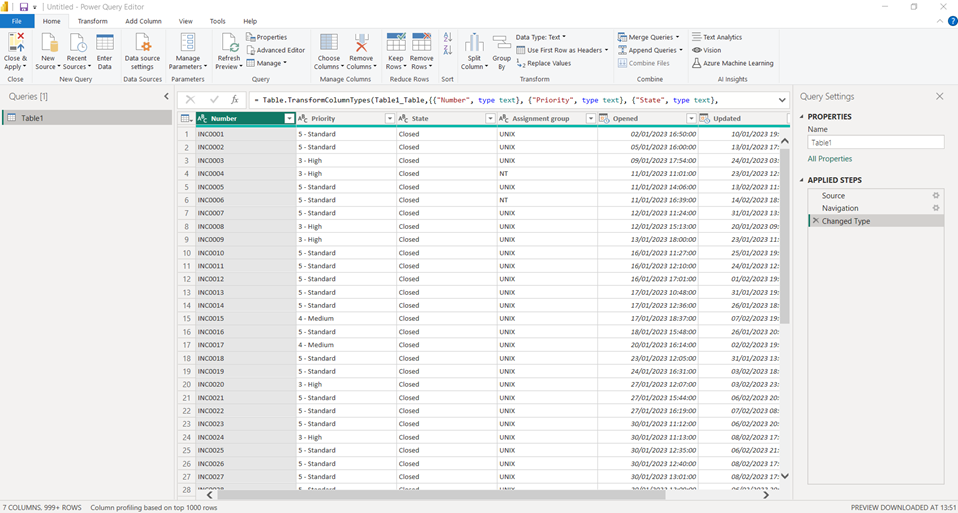
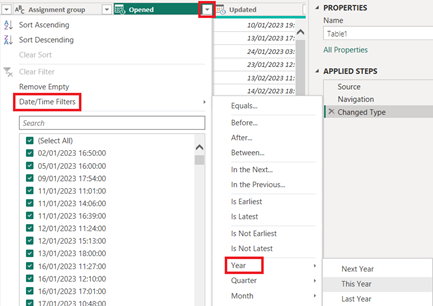
For instance, I just want to load data of the current year from the “opened” column:
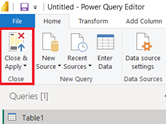
Once done, click on “close & apply”.
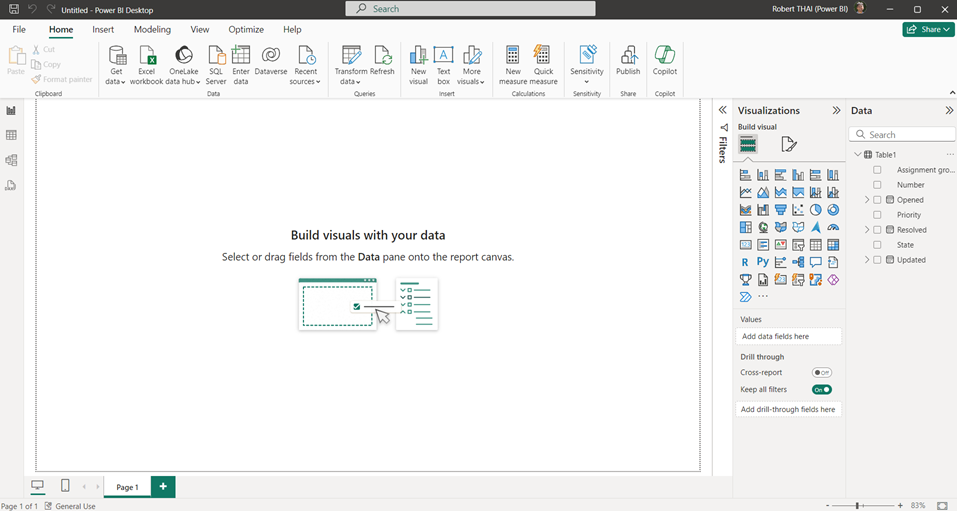
Power BI will load only data opened during the current year so old years will not be taken into account. Of course, I can reduce more and improve better my report by filtering more columns. For instance, in the “priority” column, just “3 – high” and in the “state” column, “in progress” so my data will only show all incidents with P3 “in progress” opened in the current year. Let’s reset and start from the beginning by clicking on “load” to get the “report view” window:
NOTE:
- In the future, if the size of my data increases and I want to reduce it, click on “transform data -> transform data” to show the “power query editor” window
- In the future, if I want to change the source location, click on “transform data -> data source settings” then select the file before to click on “change source”

It is in this window that I will create my visual charts, tables, etc. by using the tools from the “visualizations” panel in relation to my “data” panel. Remember my explanation about entering a manual data, I will create 2:
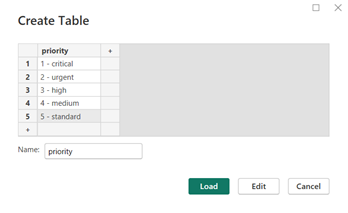 |
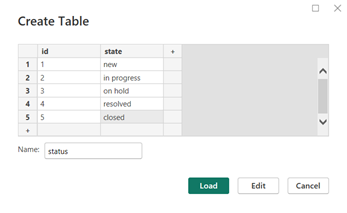 |
As you may guess, those 2 data will never change. The main advantage is, imagine I have “table1”, “table2” and “table3”; when I will create a “priority” filter, instead to create 3 (one for each table), I will only create 1 but to use it, I will have to create a relationship between them and my table by clicking on the “model view” icon then “manage relationships”:
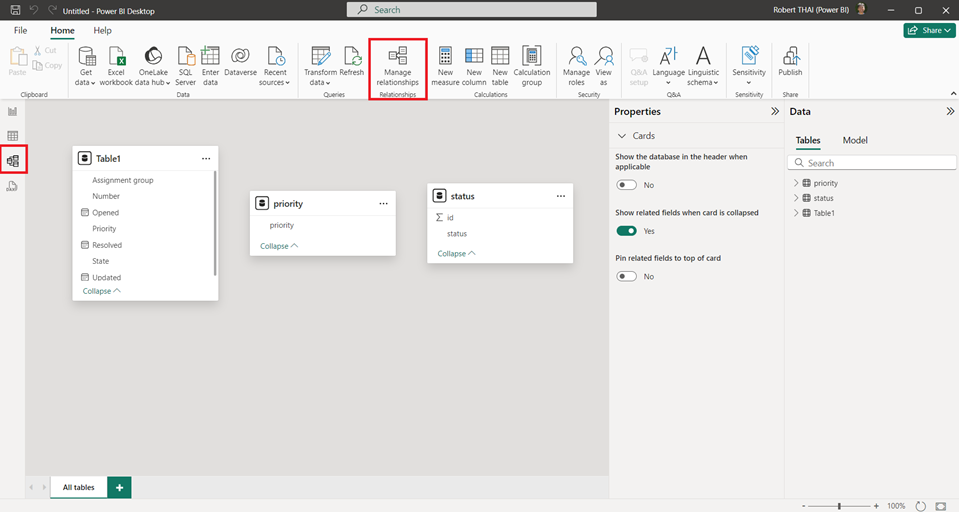
Power BI has created automatically the relationship so for an automatic detection, the column name and its values should match the column of the main table. If it was not the case, I will have to do it manually by clicking on “new relationship”.

To see the data, I will click on the “table view” icon:
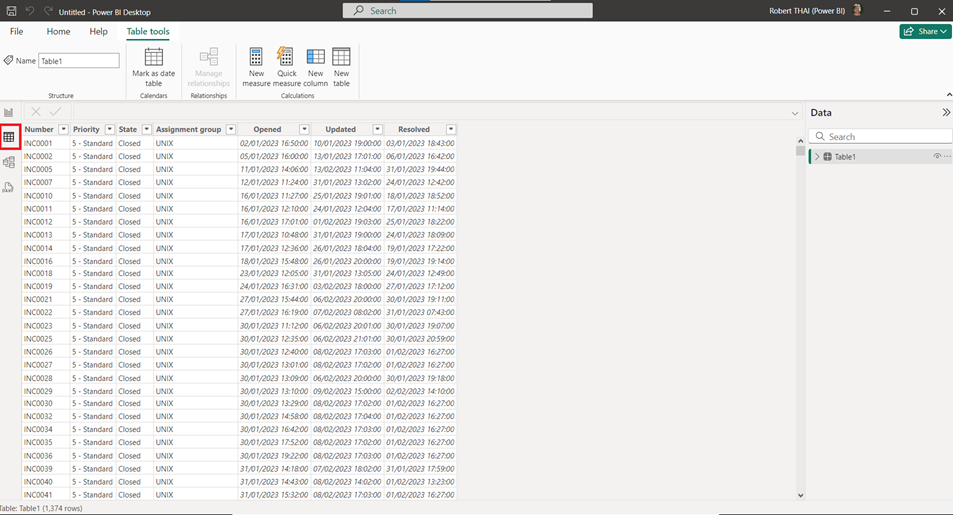
In this window, I can format my data. For instance, by selecting the “opened” column, the “column tools” will appear:
- Data type: I can change the type
- Format: I can change how to display the information
- Summarization: I can change how to summarize the total
- Sort by column: I can reference another column to sort
- Data groups: I can group the data

NOTE: in some cases, it will not be possible to format data in this view so I will need to do it in the “power query editor” window.
You just learn the way to prepare your data in order to create visuals in the next Part 2: create the report.
Interesting Topics
-

Be successfully certified ITIL 4 Managing Professional
Study, study and study, I couldn’t be successfully certified without studying it, if you are interested...
-

Be successfully certified ITIL 4 Strategic Leader
With my ITIL 4 Managing Professional certification (ITIL MP) in the pocket, it was time to go for the...
-

Hide visual and change background color based on selection
Some small tricks to customize the background colour of a text box...
-

Stacked and clustered column chart or double stacked column chart
In excel, I use a lot the combination of clustered and stacked chart...


