Power BI: create, publish and update a dashboard for beginners - Part 3: share with the audience
This tutorial is divided in 4 parts and this article is the part 3:
- Part 1: upload the data
- Part 2: create the report
- Part 3: share with the audience
- Part 4: create the dashboard
This part is to show you how to share the report with other people. For that, I will need to upload it in the web and there are 2 options:
- If you don´t have a license (not free), you will be able only to put it in your workspace called “my workspace”
- If you have a license, you can either put it in “my workspace” or create a new workspace
I will describe the steps to create a new workspace so if you don’t have a license, skip this part and scroll down until the “publish” section.
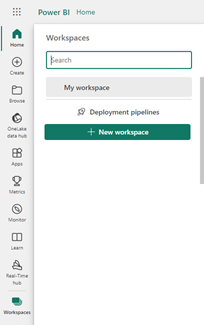
Go to the Power BI Service then click on “workspaces -> new workspace”:
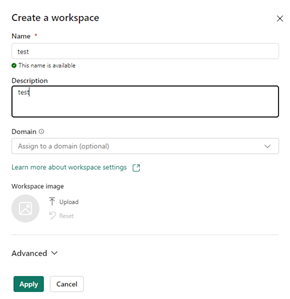
Fill up fields then click on “apply”:
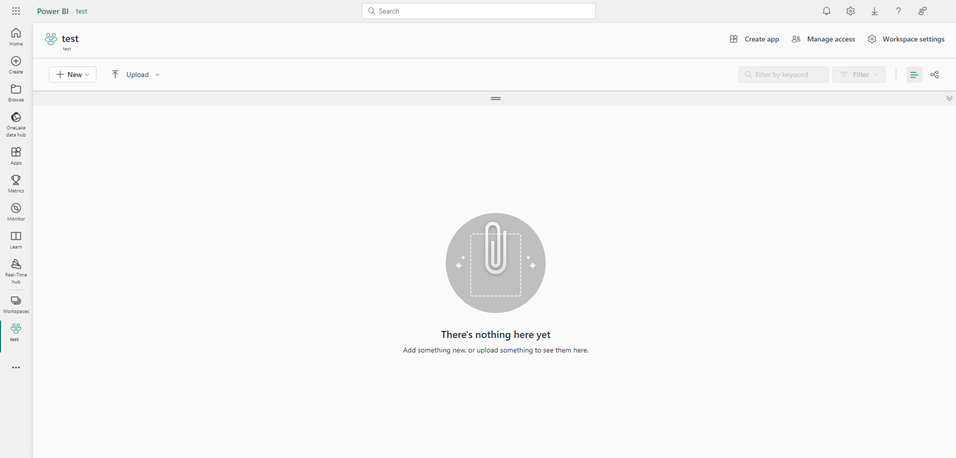
The new workspace will open totally empty:
I will go back to my Power BI Desktop, click on “publish” then look for “my workspace” (free account) or for “test” (new workspace) and click on “select”:
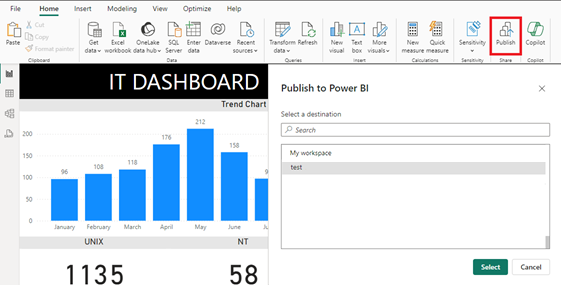
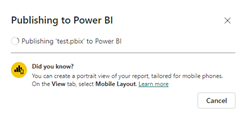
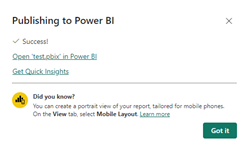
Those popups will appear if all go well:
 |
 |
I will go back to the workspace and in few seconds, my report will appear (if not, refresh your browser). Now to share it, based on your account, go to the corresponding section.
Free license
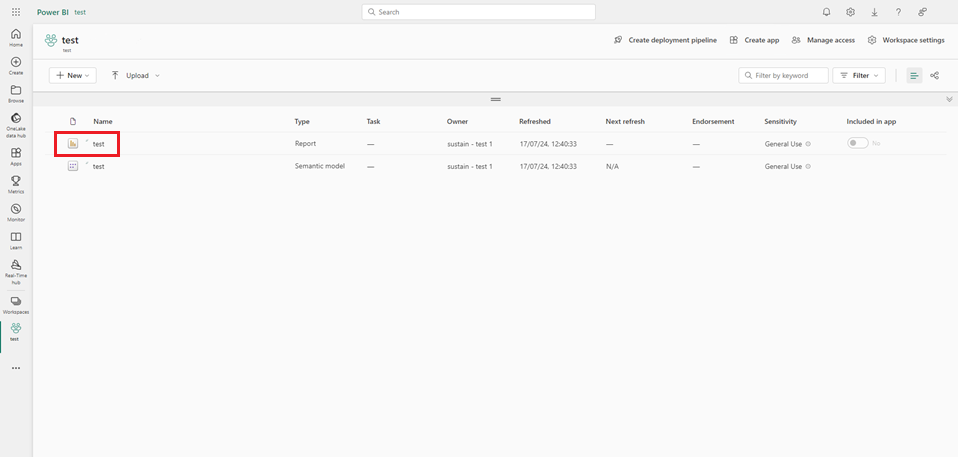
Click on the report then on “export”:
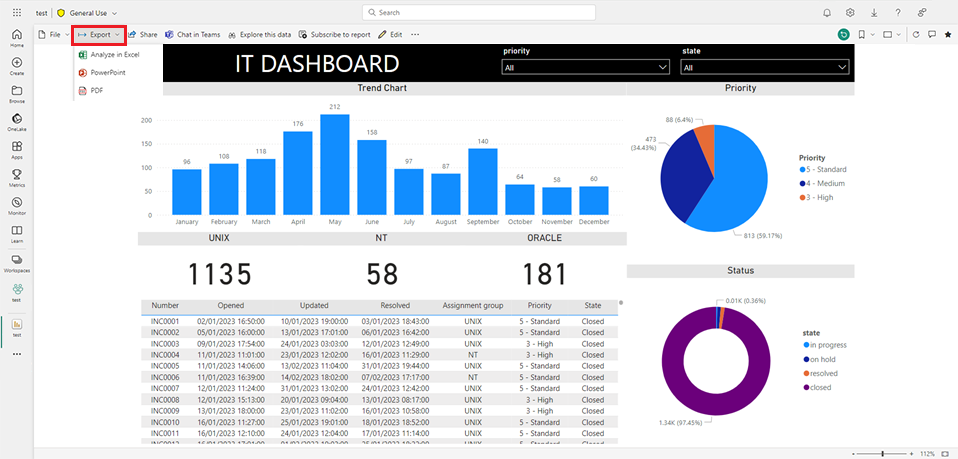
Select one of the options that will work best for you.
Paid license
There are 2 options, for the first one, instead to click on “export”, click on “share”

For more details about those options, go to the Microsoft share Power BI reports and dashboards page.
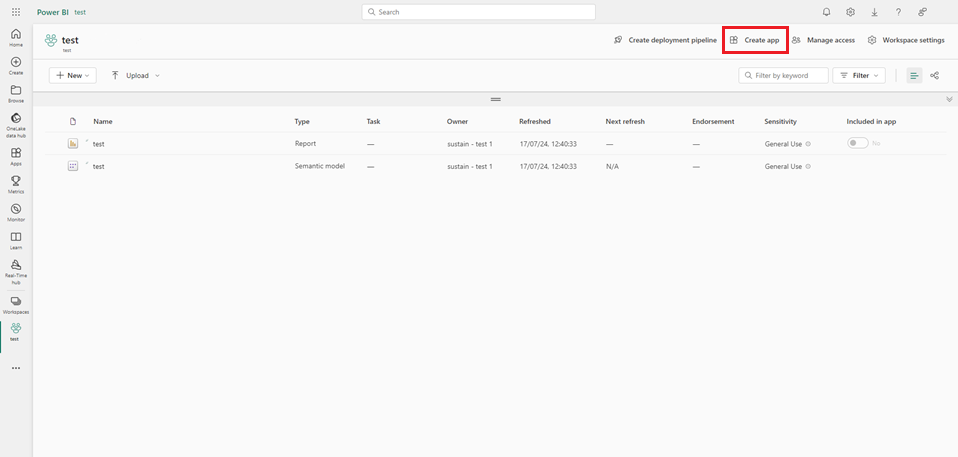
For the second option (it is the one I use for the company), click on “create app”:
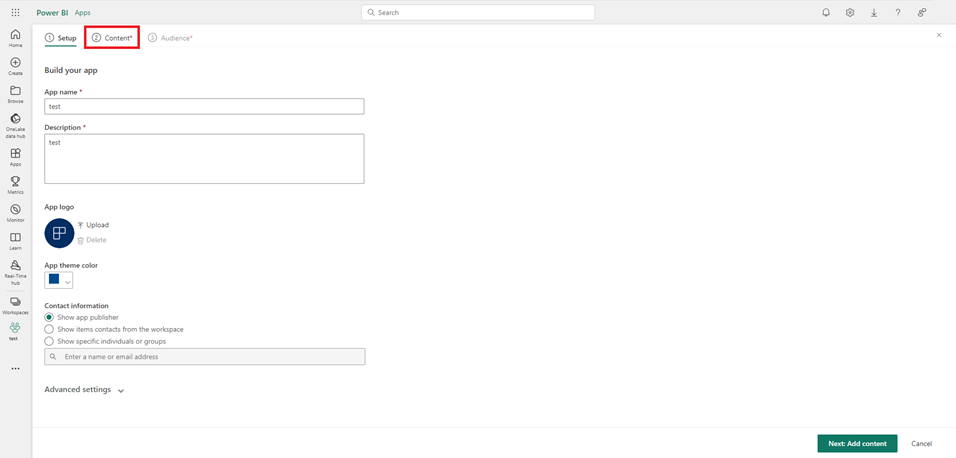
On the “setup” step, fill up fields then click on “next add content” or “2 content” (if it the same thing):
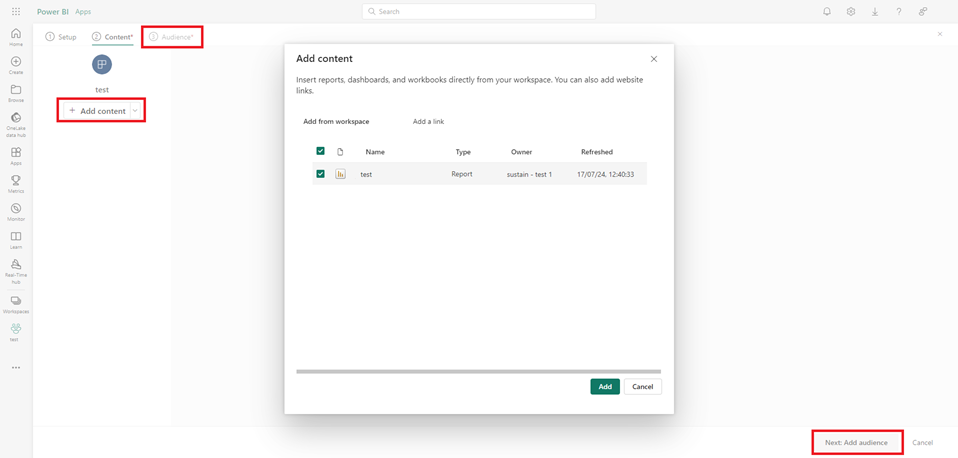
In the “2 content”, click on “+ add content” then I will add my report:
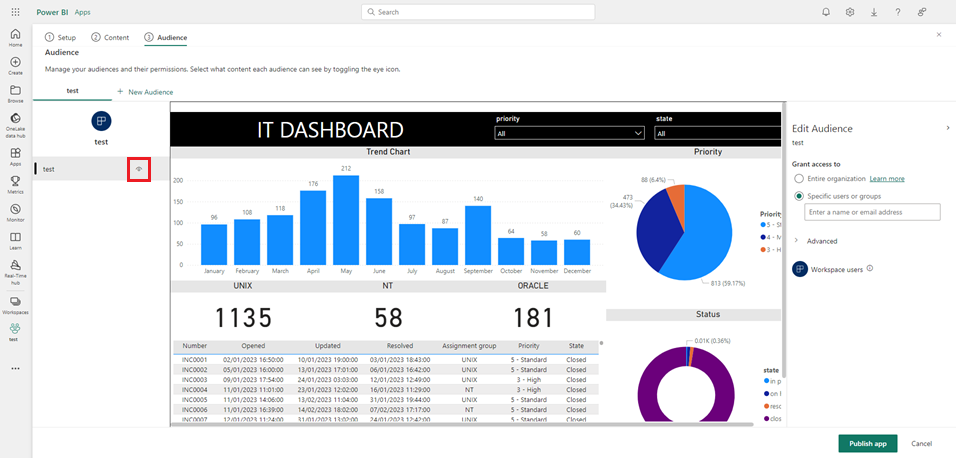
Click on “next add audience” or “3 audience” (same thing). On the left side, click on the “eye” to activate it and on the “edit audience” panel (right side), just select the option you need. Once done, click on “publish app”:
This message will appear:

Click on “publish” and the last popup will appear:

Just copy the link and share it with your colleagues. To see my report online, just click “go to app”:
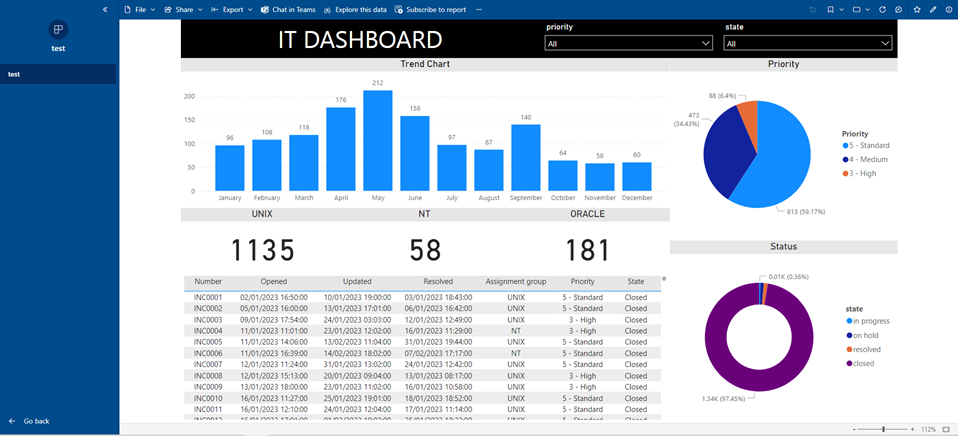
NOTE: if after doing a refresh of your online report to actualize your data, all or some visuals appear empty and/or results are not matching with your local report (in your PC/laptop), the reason may be:
- The filters, either in your formula and/or in your slicer, select the “right” options directly instead to use “select all” then exclude the unwanted options
- The results, instead to use calculated columns/table, create them in your source data to import them in your local report
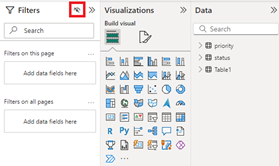
Do you remember about hiding or not “filters”, as you can see the picture above, on the right side, “filters” is not here because I hided the full panel. Imagine now that I didn’t hide it but only some filters (in my tutorial in part 2, only “priority”), from my Power BI desktop, I will click on the “eye” icon to unhide it:
 |
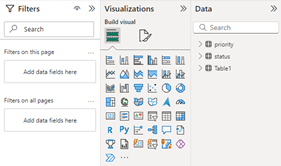 |
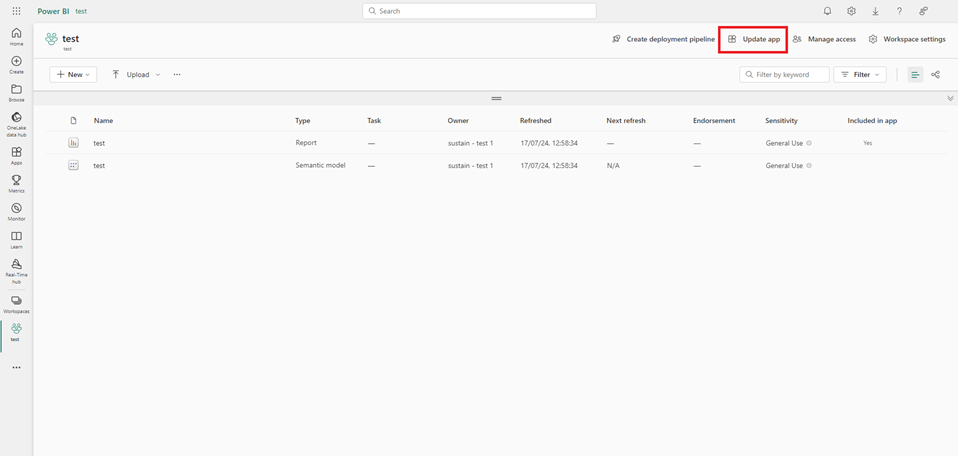
Click again to “publish”, in fact, each time that I will change something, I need to publish it again. Go back to the workspace and click “update app”
Now “filters” appear on the right, it is empty:
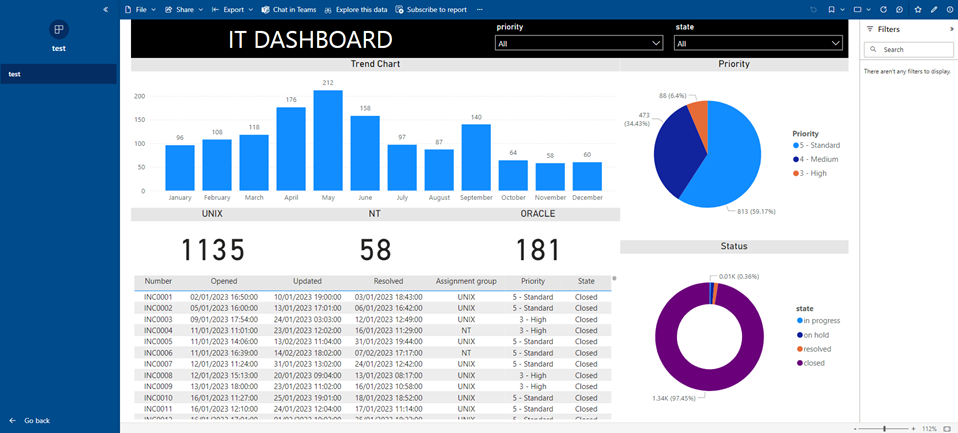
So if I select “priority”, nothing (if you remember, I hided it to avoid misunderstanding) but if I select the table:
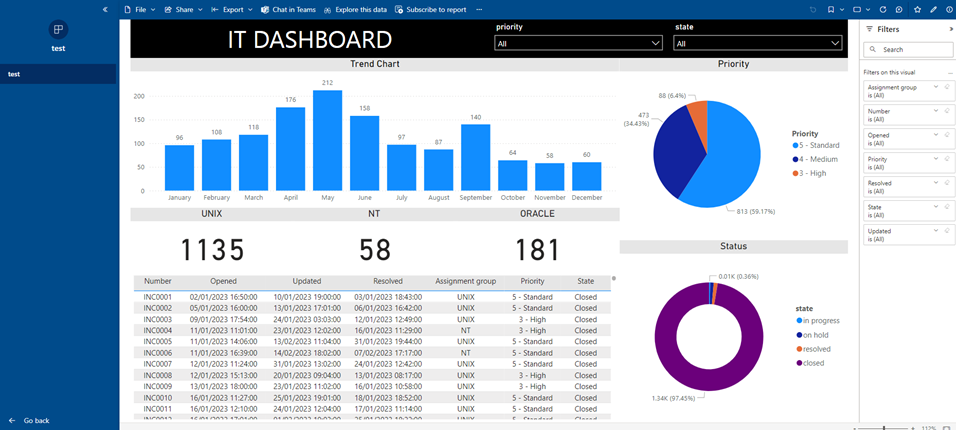
As you can see, the columns will appear as a filter and everyone can filter the table. As you may guess, the advantage is that I can have additional filters without creating many visual slicers like “priority” and “state” so more space to put other visual types.
Now that all are set up, I will have to update my data in the future. Depending if my data is located on my PC or in internet (for instance onedrive, sharepoint, etc.), the process is not the same.
If my data is on my laptop, in the Power BI Desktop, click on “refresh” then publish it again. In this case, I will have to repeat the process I told before, go to the “workspace -> update app”.

If my data is in the web, in the Power BI Service, go to the workspace, click on “schedule refresh”:
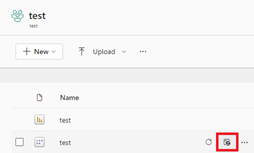
Click on “data source credentials” to make sure there is no error like this one:

If you have it, just click on “edit credentials” and fill up your account. Once done, it will be like that:

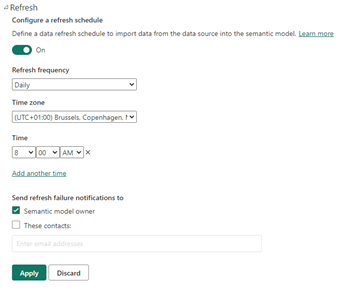
Expand the “refresh” by clicking on the arrow then turn on the option. In “refresh frequency” and “time zone”, select the corresponding option then click on “add another time”:
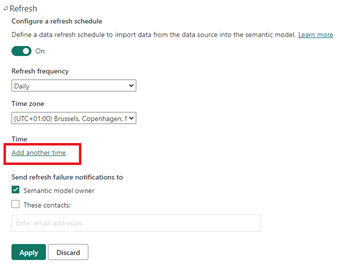
Put the time you want then click on “apply”.
You just learn the way to share your report with your colleagues and you can stop here because the last steps can be skipped if you don´t need to create a dashboard, it not the next Part 4: create the dashboard.
NOTE: if you want to create “alerts”, for instance to get notify by email for some data, you need to have a dashboard, read Power BI: create an alert for notification
Interesting Topics
-

Be successfully certified ITIL 4 Managing Professional
Study, study and study, I couldn’t be successfully certified without studying it, if you are interested...
-

Be successfully certified ITIL 4 Strategic Leader
With my ITIL 4 Managing Professional certification (ITIL MP) in the pocket, it was time to go for the...
-

Hide visual and change background color based on selection
Some small tricks to customize the background colour of a text box...
-

Stacked and clustered column chart or double stacked column chart
In excel, I use a lot the combination of clustered and stacked chart...


