Power BI: create, publish and update a dashboard for beginners - Part 4: create the dashboard
This tutorial is divided in 4 parts and this article is the part 4:
- Part 1: upload the data
- Part 2: create the report
- Part 3: share with the audience
- Part 4: create the dashboard
As explained in my tutorial part 1, a dashboard has to be created from reports so if I don’t have created any reports or if my colleagues don’t share any reports with me, I won’t be able to create one.
As you may understand, a dashboard is a compilation of data from 1 or multiple reports so what I am going to do it is to copy data from those reports and to paste them in my dashboard by pinning them.
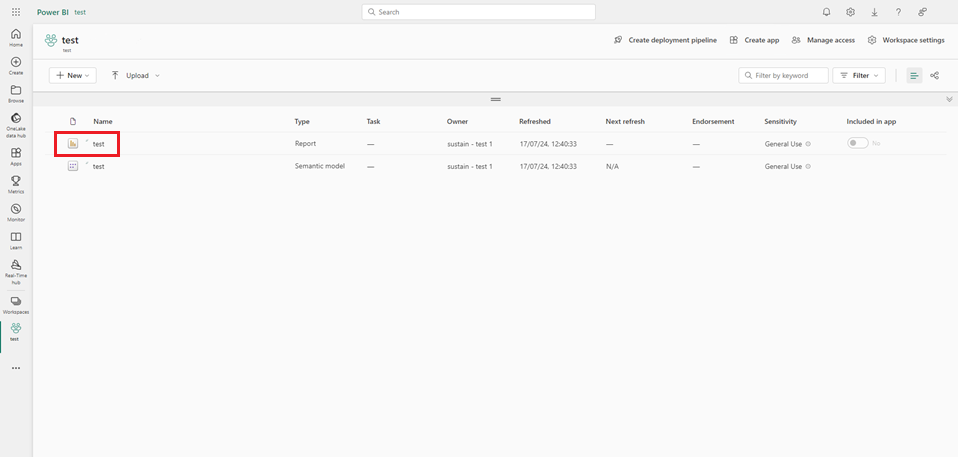
From the workspace, I will select my report:
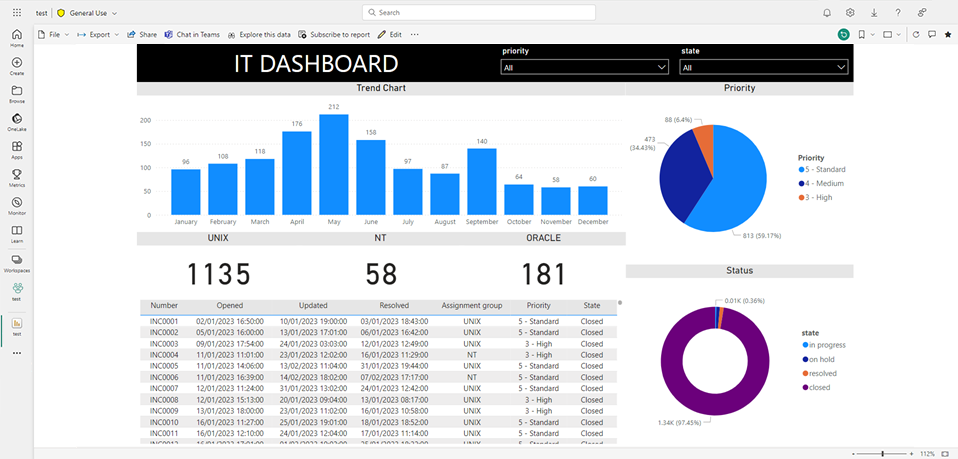
I will pin the “unix” visual:

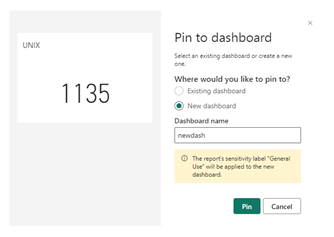
A popup will appear and since it is the first one, I will select “new dashboard” and put a name:
If all go well, I will get this message:

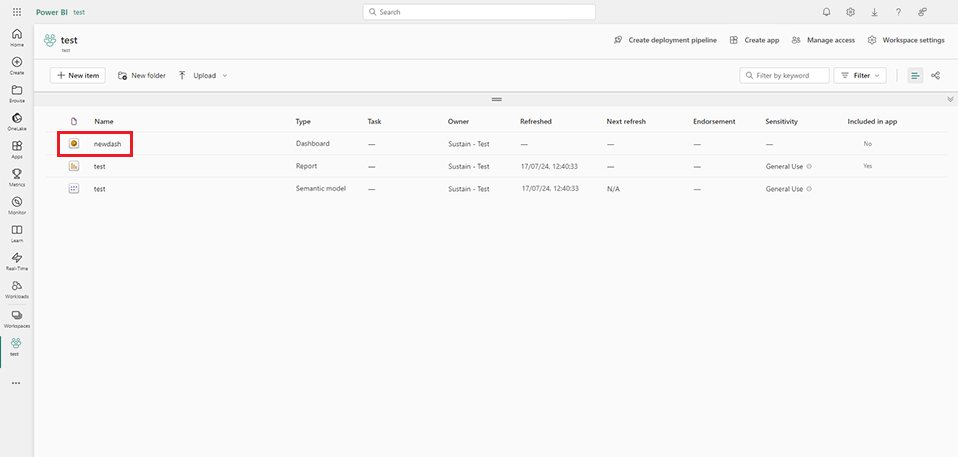
To see it, just click on “go to dashboard” or go back to the workspace then select the dashboard:
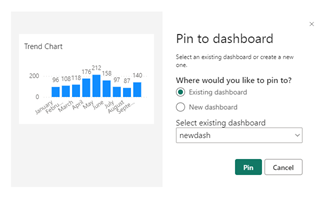
I will also pin the “trend chart” but this time, I will select “existing dashboard”:
This is the result:
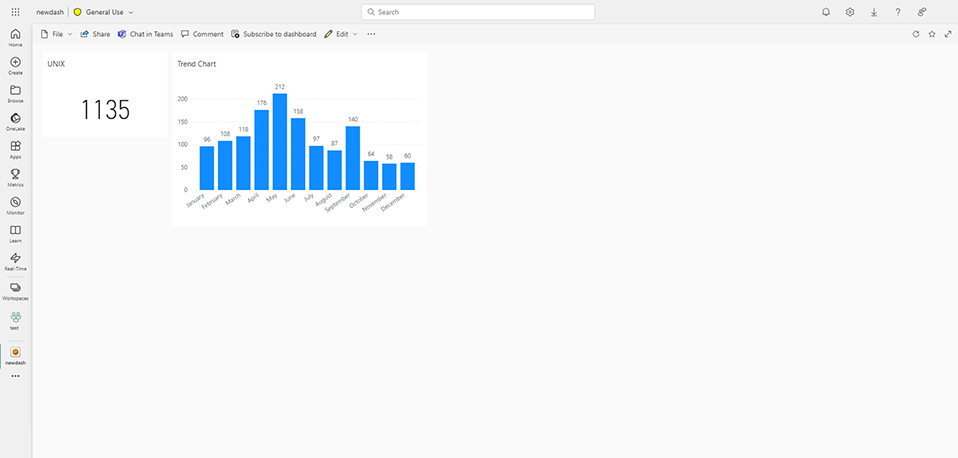
The visuals can be moved or make them bigger or smaller. To share it, it will be the same process as for the “report” described in the part 3: share with the audience.
This is the end of my tutorial, you learn how to create your dashboard, to publish your report and to share with your audience and to update your data. Of course, what I show you, it is the basic, you can do a lot more by playing with the tool and if you have some doubts, just check my different articles in Archives.
Interesting Topics
-

Be successfully certified ITIL 4 Managing Professional
Study, study and study, I couldn’t be successfully certified without studying it, if you are interested...
-

Be successfully certified ITIL 4 Strategic Leader
With my ITIL 4 Managing Professional certification (ITIL MP) in the pocket, it was time to go for the...
-

Hide visual and change background color based on selection
Some small tricks to customize the background colour of a text box...
-

Stacked and clustered column chart or double stacked column chart
In excel, I use a lot the combination of clustered and stacked chart...
-

Refresh Power BI
From the Power BI Service, I can set refresh but, for instance, there is no option to do it monthly or each time a change is made...
-

Power BI alerts to be sent by email from an excel file based on condition
I will explain how to send a list of emails from an excel file after creating alerts...


