Power BI: display value on criteria with a measure
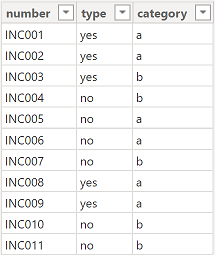
It is quite simple to display value by using filters so this article is not about that but about how to do it using a DAX formula using a measure. I will use this example:

The goal is to display values of the “number” column based on the criteria “type”, “category” or both. The formula with 1 criteria:
CONCATENATEX(FILTER('table','table'[argument1]="criteria"),'table'[argument2],", ")
NOTE: instead to separate the value with a coma, just replace “,” by whatever you want.

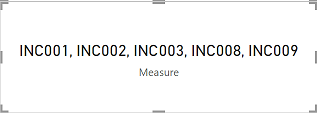
For my example, it shows all “number” according to the “type” = “yes”. The result:

The formula with 2 criterias or more:
CONCATENATEX(FILTER('table',
'table'[argument1]="criteria1"
&&'table'[argument2]="criteria2"),
'table'[argument3],", ")
NOTE: to add another criteria, just add “&&'table'[argument]="criteria")” below the line of “criteria1”.

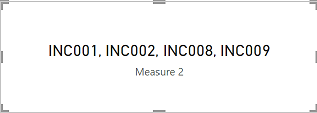
For my example, it shows all “number” according to the “type” = “yes” and “category” = “a”. The result:

And to end, the formula combining “and” (&&) and “or” (||) conditions:
CONCATENATEX(FILTER('table',
'table'[argument1]="criteria1"
&&('table'[argument2]="criteria2"||'table'[argument2]="criteria3")),
'table'[argument3],", ")
Interesting Topics
-

Be successfully certified ITIL 4 Managing Professional
Study, study and study, I couldn’t be successfully certified without studying it, if you are interested...
-

Be successfully certified ITIL 4 Strategic Leader
With my ITIL 4 Managing Professional certification (ITIL MP) in the pocket, it was time to go for the...
-

Hide visual and change background color based on selection
Some small tricks to customize the background colour of a text box...
-

Stacked and clustered column chart or double stacked column chart
In excel, I use a lot the combination of clustered and stacked chart...


