Power BI: find the maximum value of unique numbers
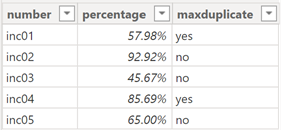
There are 3 ways I know how to search for the higher value for unique numbers. For the first one, I will use the “group by” function from the power query but before to start, take note that this method may modify the structure of the table. Let´s say that I have this table:
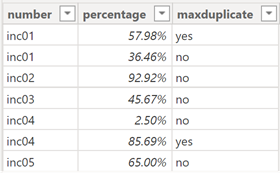
“inc01” and “inc04” are duplicate and one of percentage is higher than the other so to remove the lower one:
- Click on “transform data -> transform data”

- Select the duplicate column, in my case, it is “number”
- Click on “Home -> group by”

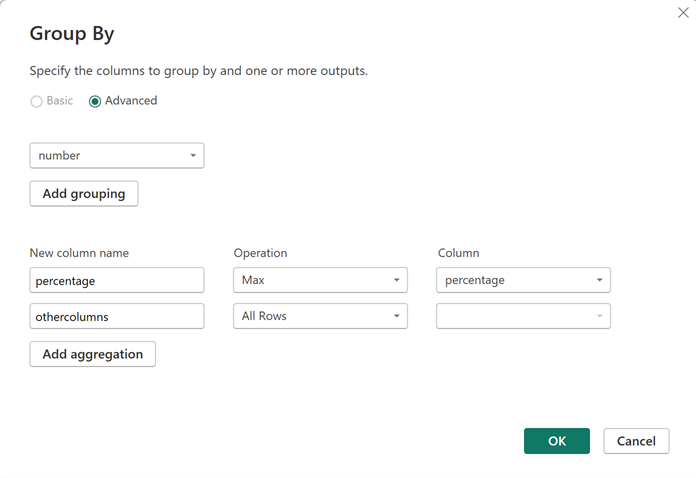
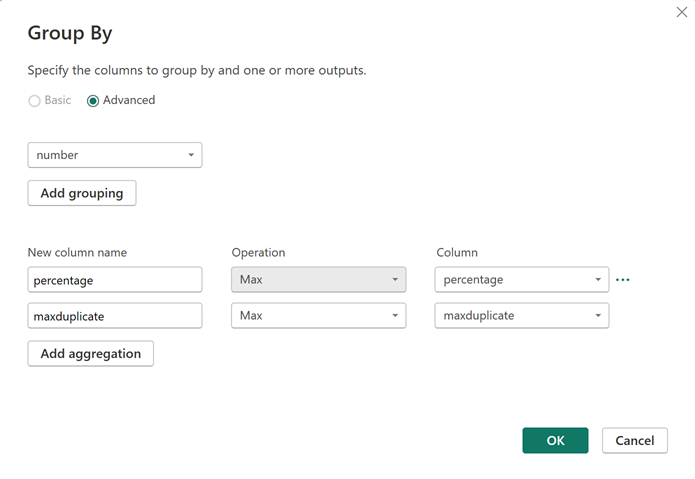
From here, there are 2 options, the left one will focus on “number” and “percentage” columns and for the other columns, it will group them in one single column. The right one will focus on all columns:
| Left option | Right option |
 |
 |
 |
 |
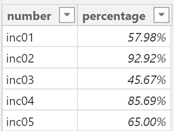
| Final result | |
 |
 |
NOTE: for the minimum value, select Min instead of Max
On the left option, only “number” and “percentage” columns are showing and the other ones have disappear (in my case, the “maxduplicate” column). On the right option, to keep all columns, I need to add an aggregation for each column (in my case, just need to click once).
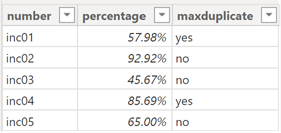
The second method is to create a new table from the main table so click on “home -> new table”:

Put this formula:
SUMMARIZE('table','table'[argument1],"value2",MAX('table'[argument2]),"value3",MAX('table'[argument3]))

NOTE:
- Replace “table”, “argument” and “value” by yours
- For the minimum value, replace MAX by MIN
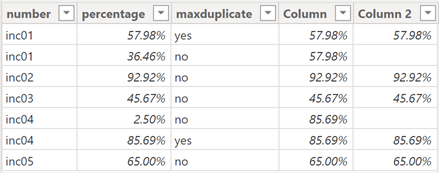
The last method is to use only the main table so I will add a new column:

With this formula:
CALCULATE(MAX('table'[argument1]),ALLEXCEPT('table','table'[argument2]))

NOTE: to add another criteria, in ALLEXCEPT, just add another argument. For instance:
ALLEXCEPT('table','table'[argument2],'table'[argument3])
If I want to remove the lower value, I will use this one:
IF(CALCULATE(MAX('table'[argument1]),ALLEXCEPT('table','table'[argument2]))='table'[argument1],
'table'[argument1],BLANK())

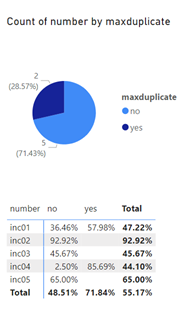
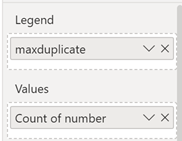
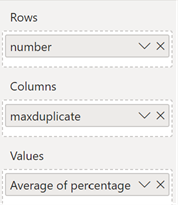
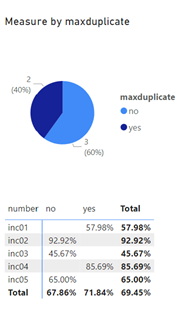
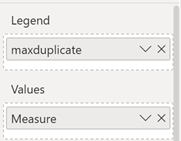
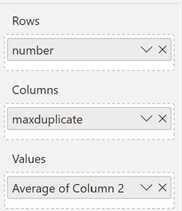
Now, let´s do some visuals with the last method because for the first and second one, there is no need for some extra explanation. On the left, using the default columns and on the right using the new ones but first, I will have to create a measure with this formula:
CALCULATE(COUNT('table'[argument1]),NOT('table'[argument2])=BLANK())

| Left visual | Left build | Right visual | Right build |
 |
  |
 |
  |
This article Power BI: calculate the (high) value of unique numbers may interest you.
Interesting Topics
-

Be successfully certified ITIL 4 Managing Professional
Study, study and study, I couldn’t be successfully certified without studying it, if you are interested...
-

Be successfully certified ITIL 4 Strategic Leader
With my ITIL 4 Managing Professional certification (ITIL MP) in the pocket, it was time to go for the...
-

Hide visual and change background color based on selection
Some small tricks to customize the background colour of a text box...
-

Stacked and clustered column chart or double stacked column chart
In excel, I use a lot the combination of clustered and stacked chart...
-

Refresh Power BI
From the Power BI Service, I can set refresh but, for instance, there is no option to do it monthly or each time a change is made...
-

Power BI alerts to be sent by email from an excel file based on condition
I will explain how to send a list of emails from an excel file after creating alerts...


