Power BI: reading window to display better the information
Imagine that I have this table:

To create a reading panel, there are 2 options, using the card or a text box but before that, I will need to create a measure with this formula:
IF(ISBLANK(SELECTEDVALUE('table'[argument])),"what to do sentence",SELECTEDVALUE('table'[argument]))

NOTE: replace “table” and “argument” by yours.
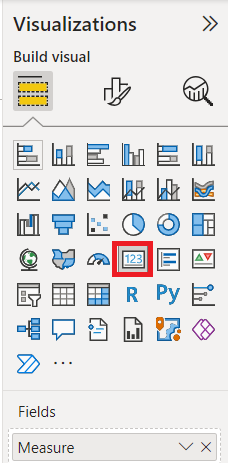
Once done, I will create a visual card and put my measure:
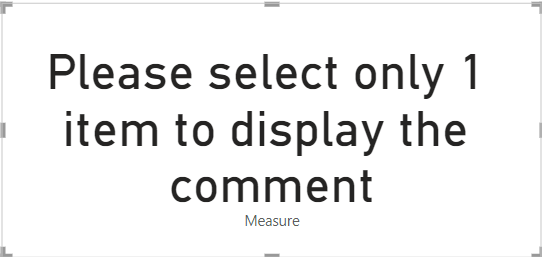
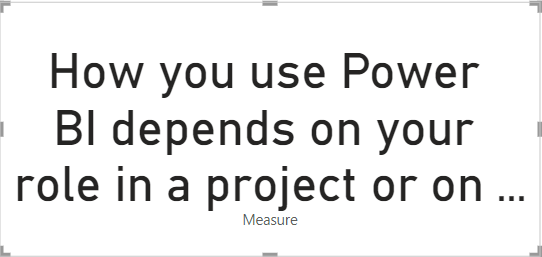
This is the result:
 |
 |
The information is big, I just need to format my visual by changing whatever I want, like the font size, remove the label, put another color, etc.
If you prefer to leave blank instead of the “please select only 1 item to display the comment”, just remove it from the formula like this:

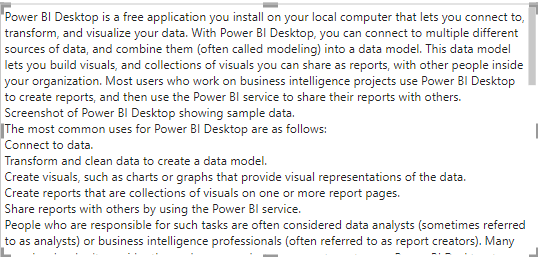
The bad point with the card, it is limited in characters so if my comment is very long, it will not show all the information no matter the smallest font size I will use. To remediate, I will use the text box:

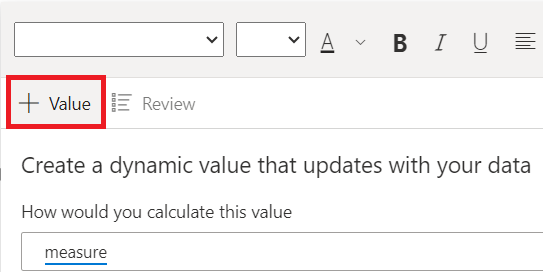
Click on “+ value” and in the “how would you calculate this value” field, I put the name of my measure then click on “save”.
 |
 |
If I have 2 different tables and I need to show also the comment, I just need to put another IF with the second table name and argument but to do something cleaner, I like to use variant like this:
var blank1=SELECTEDVALUE('table1'[argument])
var blank2=SELECTEDVALUE('table2'[argument])
return
IF(ISBLANK(blank1),IF(ISBLANK(blank2),"what to do sentence",blank2),blank1)

Interesting Topics
-

Be successfully certified ITIL 4 Managing Professional
Study, study and study, I couldn’t be successfully certified without studying it, if you are interested...
-

Be successfully certified ITIL 4 Strategic Leader
With my ITIL 4 Managing Professional certification (ITIL MP) in the pocket, it was time to go for the...
-

Hide visual and change background color based on selection
Some small tricks to customize the background colour of a text box...
-

Stacked and clustered column chart or double stacked column chart
In excel, I use a lot the combination of clustered and stacked chart...
-

Refresh Power BI
From the Power BI Service, I can set refresh but, for instance, there is no option to do it monthly or each time a change is made...
-

Power BI alerts to be sent by email from an excel file based on condition
I will explain how to send a list of emails from an excel file after creating alerts...


