Power BI: sum weekend values to show only week date
I have this incident table with some dates that fall in the weekend (Saturday and Sunday):
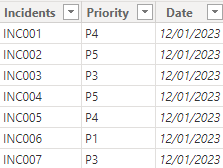
I want to calculate how many incidents I have but for my final results, I don’t want to show those weekends. I want to sum values of the weekend into the next week day, in this case, on Monday. If you are looking for the excel version, read Formula: sum weekend values to show only week date in an excel report.
First I will create a calendar with this formula by clicking on “home -> new table”:

var FullCalendar = ADDCOLUMNS(CALENDAR(MIN('table'[Date]),EOMONTH(MAX('table'[Date]),0)),"calendar",[Date],"dayname",FORMAT([Date],"DDD"))
return
SUMMARIZE(FullCalendar,[calendar],[dayname])
NOTE:
- Change “table” by yours
- MIN makes reference to the first day of my “date” column and MAX to the last day
- More information about calendar, read Power BI: create an automatically updated calendar

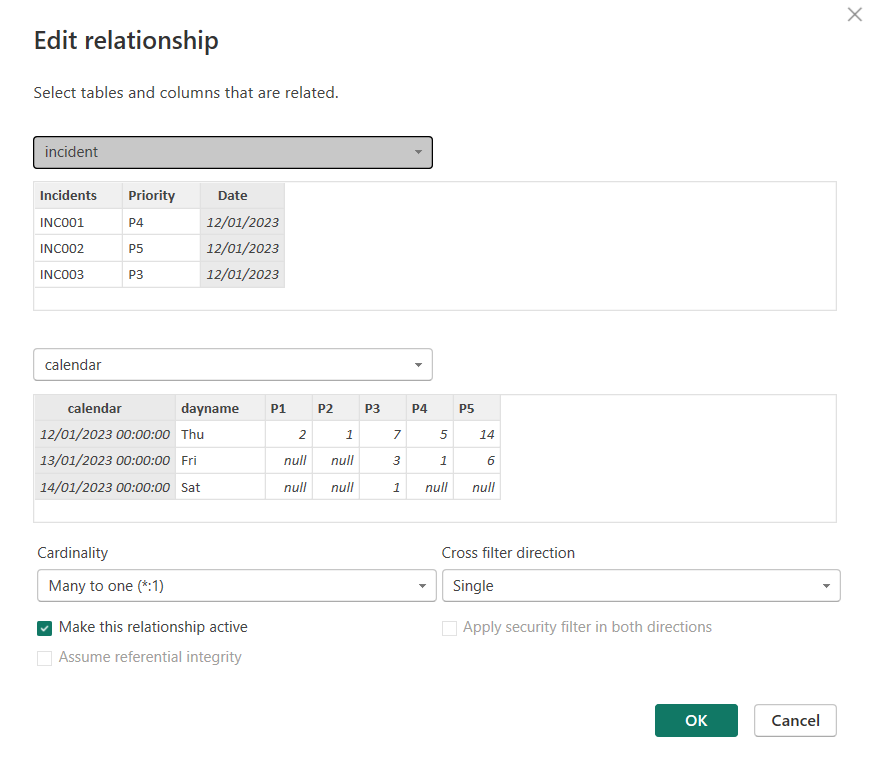
I will create a relationship between both tables:
I will add a new column with this formula to calculate incident with priority P1:
IF('table1'[argument1]="value1",CALCULATE(CALCULATE(COUNT('table1'[argument2]),'table1'[argument3]="value2"),FILTER('table1',
'table1'[argument4]='table2'[argument1]))+CALCULATE(CALCULATE(COUNT('table1'[argument2]),'table1'[argument3]
="value2"),FILTER('table1','table1'[argument4]='table2'[argument1]-1))+CALCULATE(CALCULATE(COUNT('table1'[argument2]),
'table1'[argument3]="value2"),FILTER('table1','table1'[argument4]='table2'[argument1]-2)),CALCULATE(CALCULATE(COUNT
('table1'[argument2]),'table1'[argument3]="value2"),FILTER('table1','table1'[argument4]='table2'[argument1])))

Once done, I will repeat it for P2, P3, P4 and P5 with the same formula without forgetting to change “P1” by “P2”, “P3”, etc.
NOTE: change “table” and “argument” by yours
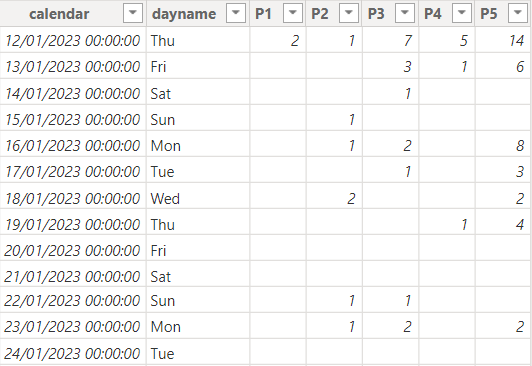
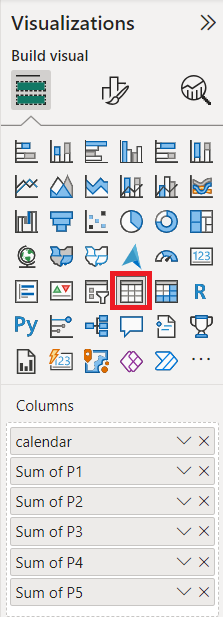
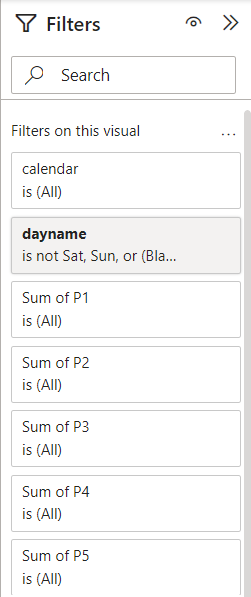
To show the results, in the “visualizations”, I will create a table and I will add those columns and in the “filters”, I will add “dayname” and I will select everything except “sat, sun or blank”:
| Table | Filters |
 |
 |
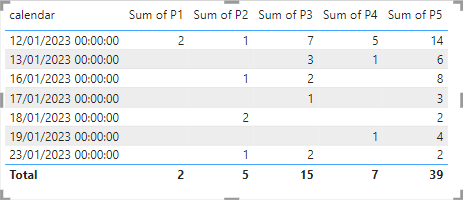
My final result:
| Results without 0 | Results with 0 |
 |
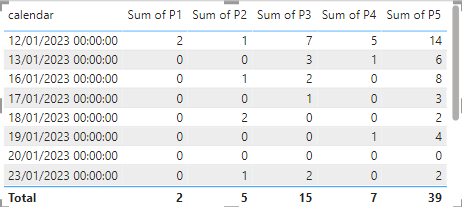 |
As we can see, the day 20 is not displaying, this is because for Friday, there are no incidents. To show 0 instead of “empty”, I will add an ISBLANK by using a variable to do it more “clear”:
var blank0=formula
Return
IF(ISBLANK(blank0),0,blank0)

To check if the calculation is correct, I can create another calendar without the name of the day:

I will create a relationship, it is the same type as the first one

And to calculate P1, this is the formula:
CALCULATE(COUNT('table'[argument1]),'table'[argument2]="value")

Alternatively, there is another solution to get the final result. If the first option is to use only 1 table, the second option is to use 2 tables, one with relationship (my calendar check) and one without so I will create a new table using the same formula as the first option:

As you may guess, this one has no relationship and for the “P1” formula:
IF('table1'[argument1]="value",CALCULATE(SUM('table1'[argument2]),FILTER('table1','table1'[argument3]='table2'[argument1]))+
CALCULATE(SUM('table1'[argument2]),FILTER('table1','table1'[argument3]='table2'[argument1]-1))+CALCULATE(SUM('table1'
[argument2]),FILTER('table1','table1'[argument3]='table2'[argument1]-2)),CALCULATE(SUM('table1'[argument2]),FILTER
('table1','table1'[argument3]='table2'[argument1])))

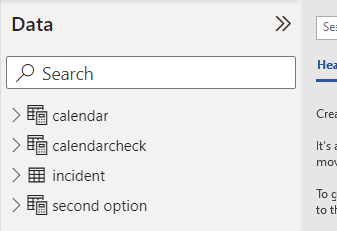
The “visualizations” will be the same as the first option. I use this second option when I am not able to have 2 relationships between one table and my main one. This is all my tables:
Interesting Topics
-

Be successfully certified ITIL 4 Managing Professional
Study, study and study, I couldn’t be successfully certified without studying it, if you are interested...
-

Be successfully certified ITIL 4 Strategic Leader
With my ITIL 4 Managing Professional certification (ITIL MP) in the pocket, it was time to go for the...
-

Hide visual and change background color based on selection
Some small tricks to customize the background colour of a text box...
-

Stacked and clustered column chart or double stacked column chart
In excel, I use a lot the combination of clustered and stacked chart...


