Power BI: using IF for different tables
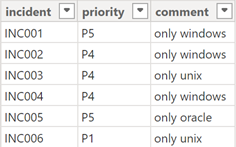
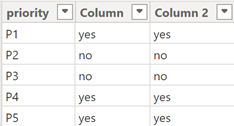
In most of my reports, I often use the IF condition, for instance, if it is equal then do that or do this. The trick part is when I have to make reference to another table so let´s take example of those 2 tables:
| Table 1 | Table 2 |
 |
 |
From the table2, I want to know which priorities are on the table1. There are 2 formulas that I can use. One with the CONTAINS function:
IF(CONTAINS('table1','table1'[argument1],'table2'[argument1]),"yes","no")

And the other one using those functions:
IF(CALCULATE(COUNTROWS('table1'),FILTER('table1','table1'[argument1]='table2'[argument1]))>0,"yes","no")


NOTE: to specify a particular value, change 'table2'[argument1] by "value"


I will add another criteria, I want to know which priorities have “unix” in the comment. In this case, I will use the second formula:
IF(CALCULATE(COUNTROWS('table1'),FILTER('table1','table1'[argument1]='table2'[argument1] && SEARCH("value",'table1'[argument2],1,0)))>0,"yes","no")

Using the first formula, I need to put exactly the full sentence of the comment:
IF(CONTAINS('table1','table1'[argument1],'table2'[argument1],'table1'[argument2],"value"),"yes","no")


Interesting Topics
-

Be successfully certified ITIL 4 Managing Professional
Study, study and study, I couldn’t be successfully certified without studying it, if you are interested...
-

Be successfully certified ITIL 4 Strategic Leader
With my ITIL 4 Managing Professional certification (ITIL MP) in the pocket, it was time to go for the...
-

Hide visual and change background color based on selection
Some small tricks to customize the background colour of a text box...
-

Stacked and clustered column chart or double stacked column chart
In excel, I use a lot the combination of clustered and stacked chart...
-

Refresh Power BI
From the Power BI Service, I can set refresh but, for instance, there is no option to do it monthly or each time a change is made...
-

Power BI alerts to be sent by email from an excel file based on condition
I will explain how to send a list of emails from an excel file after creating alerts...


