Power BI: calculate based on automatic dates (quarters, months)
In most of my reports, I need to make some comparisons between different quarters, for instance, current quarter vs previous quarter or past year quarter. The easier way is to use the filter or to specify the quarter as explained in this topic Power BI: calculate values for a specific object and show 0 instead of blank, the inconvenient is that updating the quarter, I have to do it manually.
In this topic, I will explain a way to do it that a manual update is not required so it will be done automatically. I will use quarter but it is also valid for month so imagine that I have this data:
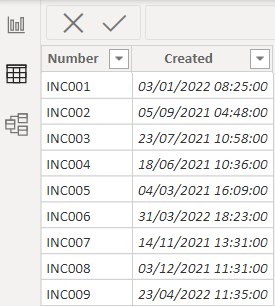
The first thing to do is to add a new column by clicking on “table tools -> new column”:

Then I will put this formula and rename “column” by “quarter number”:
YEAR('table'[argument])*4+ROUNDUP(MONTH('table'[argument])/3,0)
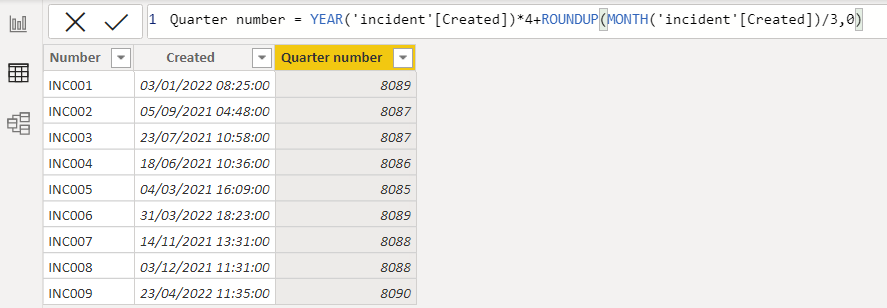
If you want by month, replace 4 by 12 and remove "/3" in the formula.
Let’s add a new column to have a quick view about which quarter corresponds each number and I rename it "quarter":
FORMAT([argument],"YYYY-Q")
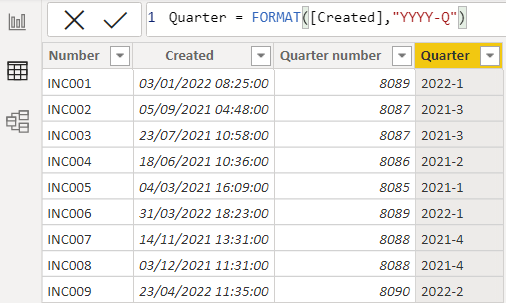
For month, it will be “FORMAT([argument],"YYYY-MM")”
I will create 2 measures by clicking on “table tools -> new measure” which will calculate the number of incidents I have for a specific quarter:
- CALCULATE(COUNT('table'[argument1]),FILTER(ALLSELECTED('table'),'table'[argument2]=MAX('table'[argument2])))
- This one is to know how many incidents I have for the current quarter, in this case, for the quarter “2022-2”, it should be 1.
NOTE: to count unique value, use “DISTINCTCOUNT” instead of “COUNT”.

- CALCULATE(COUNT('table'[argument1]),FILTER(ALLSELECTED('table'),'table'[argument2]=MAX('table'[argument2])-1))
- This one is to know how many incidents I have for the previous quarter, in this case, for the quarter “2022-1”, it should be 2.

NOTE: as you can see in the formula, at the end, there is “-1”, this number is to indicate the quarter I want before the current one. So for instance, if I want to know for the quarter “2021-2”, I will put “-4”
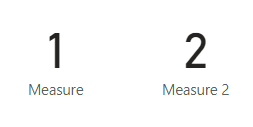
So let’s check, for the first formula, the result should be 1 and for the second, 2. For that, I will create 2 cards and put the measure in the “fields”:
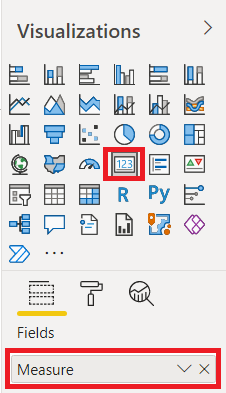
And effectively, we got the correct results:
Now I want to calculate the percentage between the current quarter and the previous quarter, I will create a new measure and put this formula:
CALCULATE(COUNT('table'[argument1]),FILTER(ALLSELECTED('table'),'table'[argument2]=MAX('table'[argument2])))/
CALCULATE(COUNT('table'[argument1]),FILTER(ALLSELECTED('table'),'table'[argument2]=MAX('table'[argument2])-1))


As you can guess, I just use the formula of "measure" divided by the formula of "measure 2".
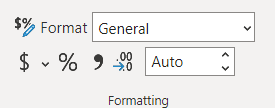
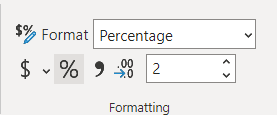
NOTE: don’t forget to change the format from “general” to “percentage”.
 |
 |
The benefice to use those formulas is that I don’t have to change a filter or something like that, specially if I create a measure like this:

I know that for the next quarter, it will be done automatically, meanwhile my data will keep growing.
Interesting Topics
-

Be successfully certified ITIL 4 Managing Professional
Study, study and study, I couldn’t be successfully certified without studying it, if you are interested...
-

Be successfully certified ITIL 4 Strategic Leader
With my ITIL 4 Managing Professional certification (ITIL MP) in the pocket, it was time to go for the...
-

Hide visual and change background color based on selection
Some small tricks to customize the background colour of a text box...
-

Stacked and clustered column chart or double stacked column chart
In excel, I use a lot the combination of clustered and stacked chart...
-

Refresh Power BI
From the Power BI Service, I can set refresh but, for instance, there is no option to do it monthly or each time a change is made...
-

Power BI alerts to be sent by email from an excel file based on condition
I will explain how to send a list of emails from an excel file after creating alerts...


