Power BI: calculate the (high) value of unique numbers
Sometimes, I need to calculate the average or the sum of something based on another column in which there are duplicate numbers or to calculate the maximum value of unique numbers. Let’s imagine that I have this data:
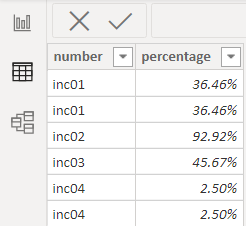
As we can see, in the “number” column, I have some duplicates and what I want, it is to calculate the average percentage by excluding them. For that, I will use this formula:
AVERAGEX(VALUES('table'[argument1]),CALCULATE(AVERAGE('table'[argument2])))
NOTE:
- Replace “table” and “argument” by yours
- To sum, use SUMX instead of AVERAGEX and SUM instead of AVERAGE
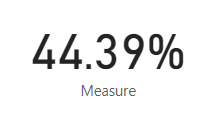
If it is correct, the result should be 44.39% (36.09% if I take in account the duplicate) according to excel.
Let’s check that, I will create a measure and put the formula:

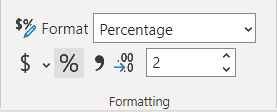
I will format this measure in “percentage”:
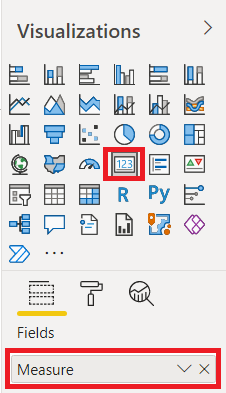
Now I will create a card and put this measure:
And the result matches with excel:
Now, let’s say that I want to calculate the higher value for the unique number for this table:
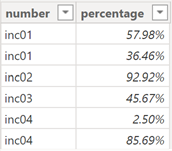
I will use this formula:
AVERAGEX(SUMMARIZE('table','table'[argument1],"value",MAX('table'[argument2])),[value])

NOTE:
- Replace “value” by yours
- For the minimum value, use MIN instead of MAX
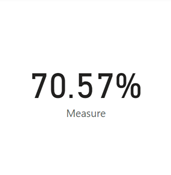
In excel, I got 70.57% (53.54% if I take in account all of them) and the measure matches it:
This article Power BI: find the maximum value of unique numbers may interest you.
Interesting Topics
-

Be successfully certified ITIL 4 Managing Professional
Study, study and study, I couldn’t be successfully certified without studying it, if you are interested...
-

Be successfully certified ITIL 4 Strategic Leader
With my ITIL 4 Managing Professional certification (ITIL MP) in the pocket, it was time to go for the...
-

Hide visual and change background color based on selection
Some small tricks to customize the background colour of a text box...
-

Stacked and clustered column chart or double stacked column chart
In excel, I use a lot the combination of clustered and stacked chart...


