Power BI: calculate in percentage based on different cell values
Imagine that I have this table and I want to know the percentage for “chocolate” between February and January:
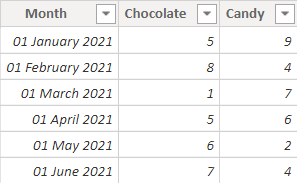
To do that, what I will do first, it is to create an index, it will allow me to select one particular cell:
- 1. Home -> transform data -> transform data

- 2. Add column -> index column -> from 1

So I will get this result and since I am satisfied, I will click on “close & apply”:

Now I will create a “new measure” by clicking on the right button (home -> new measure):
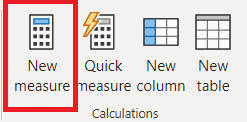
So to calculate the percentage between February and January for “chocolate”, let’s put this formula:
LOOKUPVALUE([argument1],[argument2],2)/LOOKUPVALUE([argument1],[argument2],1)

Then in the “format” field (measure tools -> format), select “percentage” and below, I will make sure that “2” is displaying. If you prefer to have only 1 or 3 decimals, just change it.
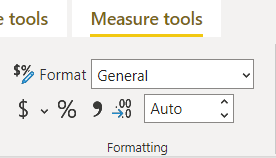 |
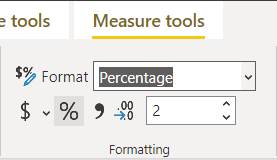 |
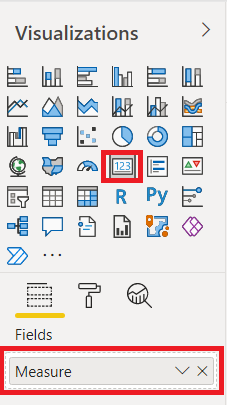
Now let’s create a score card and see the result, to do that, in the “visualizations”, select the “card” button and in the “fields”, put your “measure”, and this is the result:
 |
 |
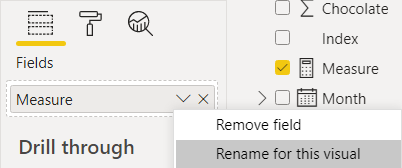
To change the name “measure”, there are 2 options:
- 1. Just rename for this card
- 2. Rename it for this table
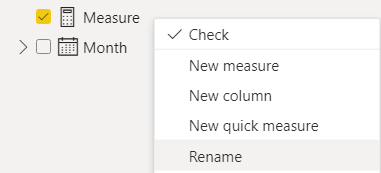
For the second option, you can also rename it by changing the name in the formula:


Just take note that by renaming it in the table, it will not change it for your visualization, in this case, use the first option or remove it and put it again into the “fields” field.
Interesting Topics
-

Be successfully certified ITIL 4 Managing Professional
Study, study and study, I couldn’t be successfully certified without studying it, if you are interested...
-

Be successfully certified ITIL 4 Strategic Leader
With my ITIL 4 Managing Professional certification (ITIL MP) in the pocket, it was time to go for the...
-

Hide visual and change background color based on selection
Some small tricks to customize the background colour of a text box...
-

Stacked and clustered column chart or double stacked column chart
In excel, I use a lot the combination of clustered and stacked chart...
-

Refresh Power BI
From the Power BI Service, I can set refresh but, for instance, there is no option to do it monthly or each time a change is made...
-

Power BI alerts to be sent by email from an excel file based on condition
I will explain how to send a list of emails from an excel file after creating alerts...


