Power BI: change the source, refresh the data and move columns
To change the source, in “home”, select “transform data” then “data source settings”.

Make sure that the new source should have the same names and numbers of columns. Otherwise, an error will appear. There are 2 solutions:
- Option 1, delete the old source then load the new one
- Option 2, instead to click on “data source settings”, click on “transform data” then select the table. On the right side, click on “changed type” and in the formula bar, just change the name of the column. Once done, click on “close & apply”.
 |
 |
If in my excel file, I delete the “new name” column, to update Power BI, I just need to delete the “new name” section:

To refresh the data, there are 2 options:
- Option 1, to refresh all data, use the “refresh” button
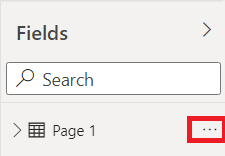
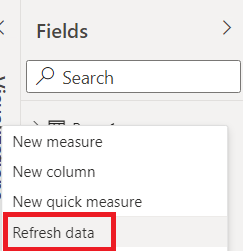
- Option 2, to refresh a specific data, in “fields”, click on the “3 dots” then select “refresh data”

 |
 |
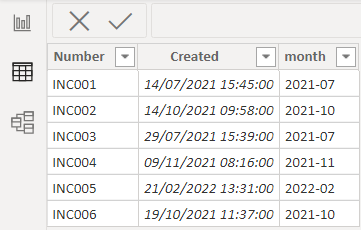
To re-order the columns, it is not possible to do it in the “calculated” columns, I mean here:

It can be done only by using the “transform data” option, there are 2 choices:
- 1. Transform data -> transform data
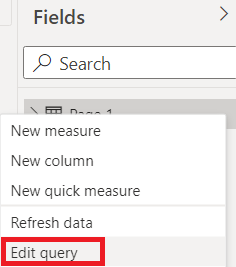
- 2. In “fields”, select the table, click on the “3 dots” then select “edit query”

 |
 |
Here I can move the columns as I want but once done, it will not reflect it in the “calculated” column view.
There is no impact on the result, it is more about “esthetic” than anything else but if it is something that annoy you, the only way to do it, it is to start from 0, redoing everything.
Interesting Topics
-

Be successfully certified ITIL 4 Managing Professional
Study, study and study, I couldn’t be successfully certified without studying it, if you are interested...
-

Be successfully certified ITIL 4 Strategic Leader
With my ITIL 4 Managing Professional certification (ITIL MP) in the pocket, it was time to go for the...
-

Hide visual and change background color based on selection
Some small tricks to customize the background colour of a text box...
-

Stacked and clustered column chart or double stacked column chart
In excel, I use a lot the combination of clustered and stacked chart...


