Power BI: show negative and positive percentage
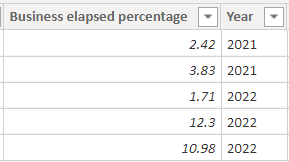
I will explain different DAX formulas, one will work better than the others depending on what I need to do. For that, let’s take this data as example:

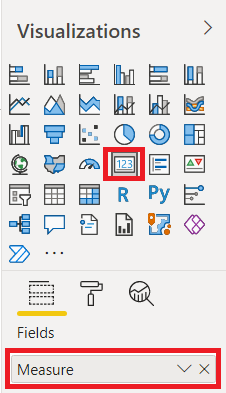
To see the result, first I will create a measure by clicking on “home -> new measure” and put the formula. Secondly, I will create a “card” in the visualization and in the “fields”, I put the “measure”.


If I do a simple total of the first column, I get this result:

Now I want to show it as percentage, the easy way is:
ROUND(SUM('table'[argument]),2)&"%"

But as you can see, there is no the plus sign since the percentage is positive, to remediate it:
FORMAT(SUM('table'[argument])/100,"+0.00%;-0.00%")

Now, let’s do something else, I want the percentage between 2022 and 2021, my formula will be like this:
ROUND((CALCULATE(SUM('table'[argument1]),'table'[argument2]="xxx")/
CALCULATE(SUM('table'[argument1]),'table'[argument2]="xxx"))*100,2)&"%"

So to show the positive or negative sign, I can use the “format” option:
FORMAT((CALCULATE(SUM('table'[argument1]),'table'[argument2]="xxx")/
CALCULATE(SUM('table'[argument1]),'table'[argument2]="xxx")),"+0.00%;-0.00%")

Or I can use this option by defining a variable:
var npsign = ROUND((CALCULATE(SUM('table'[argument1]),'table'[argument2]="xxx")/
CALCULATE(SUM('table'[argument1]),'table'[argument2]="xxx"))*100,2)
RETURN IF(npsign>0,"+"&npsign&"%",npsign&"%")

Just to show the negative sign in case of negative percentage:

Interesting Topics
-

Be successfully certified ITIL 4 Managing Professional
Study, study and study, I couldn’t be successfully certified without studying it, if you are interested...
-

Be successfully certified ITIL 4 Strategic Leader
With my ITIL 4 Managing Professional certification (ITIL MP) in the pocket, it was time to go for the...
-

Hide visual and change background color based on selection
Some small tricks to customize the background colour of a text box...
-

Stacked and clustered column chart or double stacked column chart
In excel, I use a lot the combination of clustered and stacked chart...


