Power BI: sort correctly the month name in chart
When I create a clustered column chart in which I want to make some comparison for instance between different years, the month is not sorting out correctly in spite that I will ask to do so.

To remediate it, I will need to create a new column with the month ID then sort the name of the month by using the month ID.

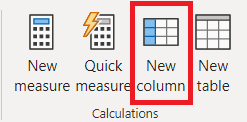
If you have a month name column, just create a new column by putting number from 1 to 12. Once you have it, jump to the last section where I explain the "sort by column" option. In the other hand, if you have a date column. Those are the steps to do it. First I will need to create the month name (January, February, etc.) for that, I will go to the data editor and click on “new column”.
 |
 |
In the formula bar, put:
FORMAT([argument],"MMMM")
I will get that:
Column = FORMAT([date],"MMMM")
I will change the name “column” by “monthname”:
monthname = FORMAT([date],"MMMM")
Secondly, I will create the month number (1, 2, 3, etc.), so I click again “new column” and in the formula, put:
MONTH([argument])
I will get that:
Column = MONTH([date])
And let’s change the name “column” by “monthid”.
Now click on “sort by column” and select “monthid”.

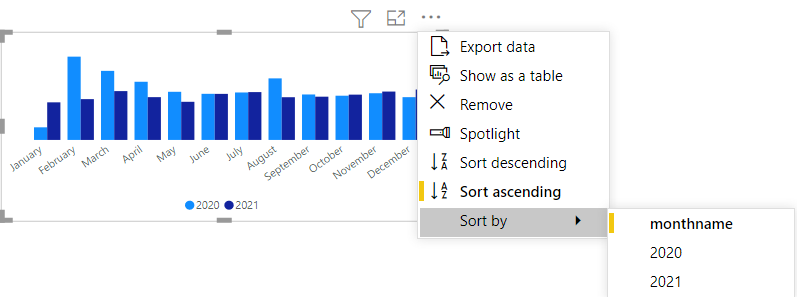
I will just have to create my chart and from the chart, I will sort by “monthname” and “sort ascending”.

Interesting Topics
-

Be successfully certified ITIL 4 Managing Professional
Study, study and study, I couldn’t be successfully certified without studying it, if you are interested...
-

Be successfully certified ITIL 4 Strategic Leader
With my ITIL 4 Managing Professional certification (ITIL MP) in the pocket, it was time to go for the...
-

Hide visual and change background color based on selection
Some small tricks to customize the background colour of a text box...
-

Stacked and clustered column chart or double stacked column chart
In excel, I use a lot the combination of clustered and stacked chart...


